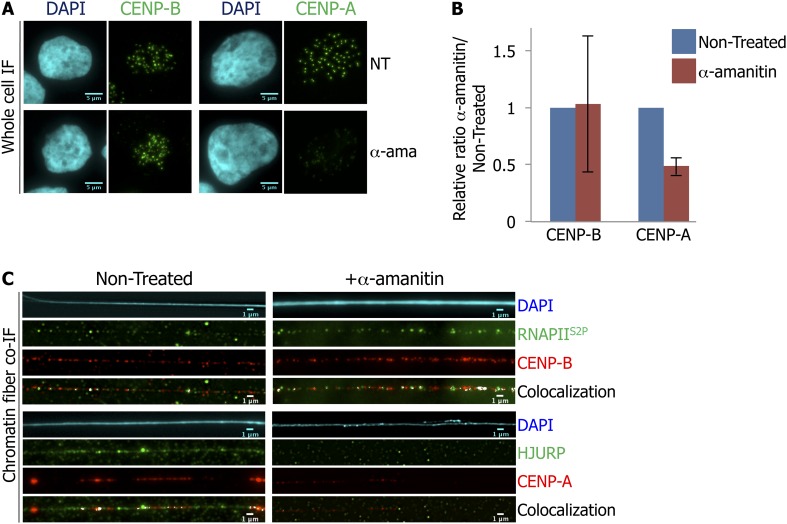
Figure 3. RNA Polymerase II (RNAPII)-dependent transcription is required for the recruitment of CENP-A and its chaperone HJURP onto the centromere at early G1 (eG1).
(A) eG1 synchronized HeLa cells were treated or not (NT) with α-amanitin (α-ama) for 2 hr before staining for centromeric proteins CENP-A or CENP-B (green). The DAPI raw image is shown for a representative cell (cyan). Three independent experiments were performed and in each, a minimum of 30 cells were analyzed per slide. Scale bar: 5 μm. (B) Signal intensity of CENP-A and CENP-B spots from (A) was quantified using ImageJ, and relative ratios of α-amanitin vs non-treated conditions were determined. Means ± SD from three independent experiments is represented on the graph. Quantification values are tabulated in Supplementary file 1. (C) Centromeric proteins CENP-A and CENP-B (red) were co-stained with HJURP (green) and RNAPII phosphorylated on serine 2 (RNAPIIS2P, green), respectively, on centromeric chromatin fibers prepared from eG1 synchronized cells treated or not with α-amanitin for 2 hr (cyan, DAPI). Three independent experiments were performed and in each, a minimum of five chromatin fibers were analyzed per slide (co-localization on the same chromatin fiber after α-amanitin compared to non-treated: between CENP-B and RNAPIIS2P = 9/15 vs 10/15; and between CENP-A and HJURP = 2/15 vs 9/15). Scale bar: 1 μm. Co-IF, co-immunofluorescence.


