Figure 1.
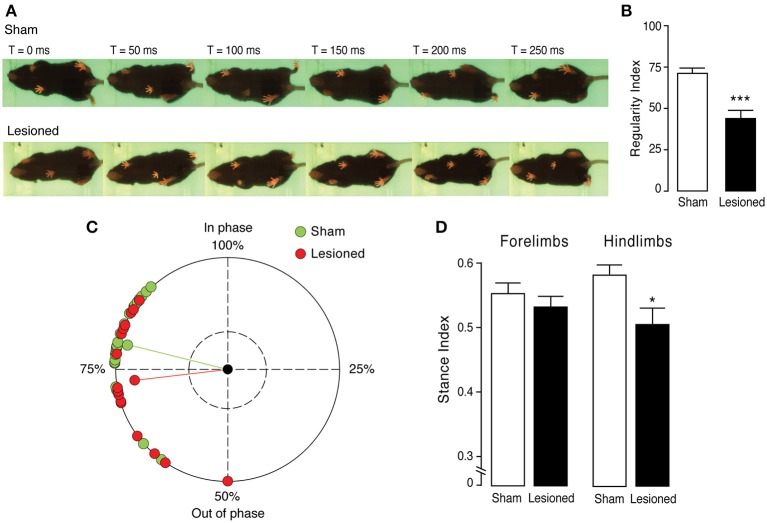
Disruption of step cycle regularity in 6-OHDA-lesioned mice. Gait dynamics and pattern of motor coordination during locomotion were analyzed in sham (n = 22) and 6-OHDA-lesioned (Lesioned) (n = 17) mice. (A) Representative images of a complete step cycle (250 ms), shown in six consecutive frames taken every 50 ms, performed by a sham (upper) and a 6-OHDA-lesioned (bottom) mouse. (B) Bar graph showing the regularity index (expressed as percentage of correct step sequences over total number of step cycles) in sham and 6-OHDA-lesioned mice. (C) The coupling interval (expressed in percent) of diagonal limbs for each sham and 6-OHDA-lesioned mouse is represented in a circular graph, which shows in phase or out of phase touches performed on the treadmill. Individual circles represent the average phase value of each animal. The dashed inner circle represents the cut off of significance. The length of the green and red lines is proportional to the statistical significance and the two circles connected to the lines represent the mean phase value of sham (green) and 6-OHDA-lesioned (red) mice. (D) Bar graph showing the relative contribution to the stride (expressed as percentage) of forelimb stance (left) and hindlimb stance (right), in sham and 6-OHDA-lesioned mice. Data are expressed as mean ± s.e.m. ***p < 0.0001, *p < 0.01 vs. sham mice, Student's t-test.

