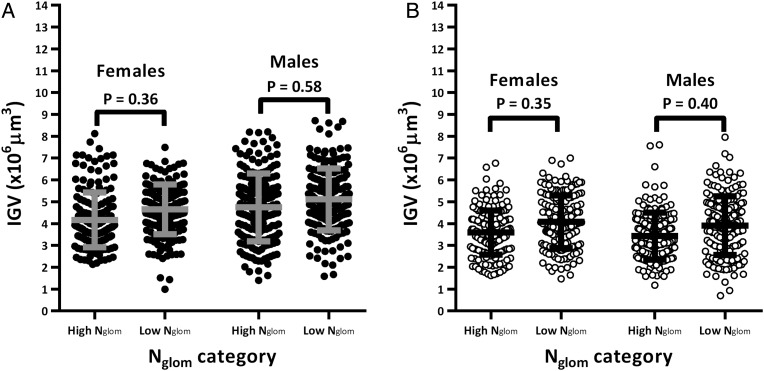
FIGURE 2:
Sex comparison of individual glomerular volume (IGV) by total nephron number (Nglom) in African and Caucasian Americans in the context of body surface area (BSA). Males were matched to females by age, Nglom and BSA (model 2). Each circle represents one glomerulus and each column represents aggregated data from six subjects per category (30 glomeruli per subject). Grey and black lines represent mean IGV and standard deviation per category.

