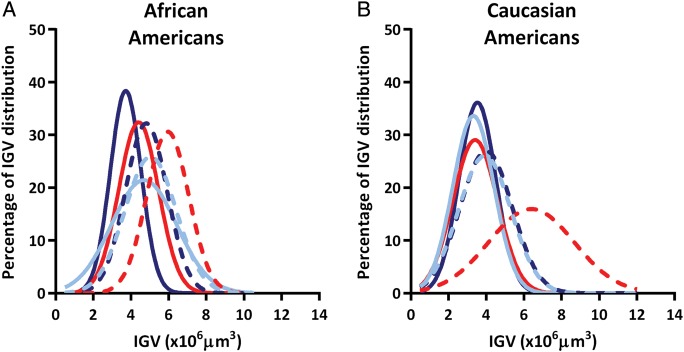
FIGURE 3:

Distributions of individual glomerular volumes (IGV) by total nephron number (Nglom), and sex in (A) African Americans and (B) Caucasian Americans; dark blue line represents females with high Nglom; dark blue dashed line represents females with low Nglom; red line represents males from model 1 (matched to females by age and Nglom) with high Nglom; red dashed line represents males from model 1 (matched to females by age and Nglom) with low Nglom; light blue line represents males from model 2 (matched to females by age, Nglom and BSA) with high Nglom; and light blue dashed line represents males from model 2 (matched to females by age, Nglom and BSA) with low Nglom.
