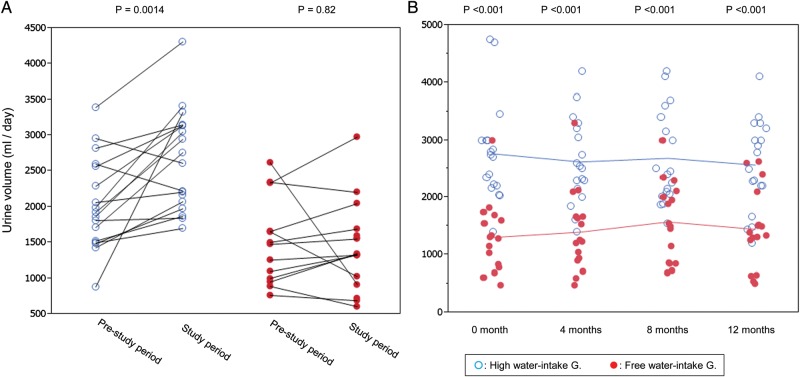
FIGURE 1:
Changes in urine volume from the pre-study period to water-study period (A), and during the water study period (B). Urine volume in the pre-study period is the mean of 24-h urine collected yearly for 2–3 years and that during the study period is the mean of four 24-h urine samples collected during the water study. Connected line represents the same patient and unconnected single points correspond to the participants without pre-study data. Single data were input to draw the figure but only paired data were used for statistical calculation. (A). In the pre-study period, urine volume was larger in the high water-intake group and further increased significantly from 2048 ± 648 to 2691 ± 710 mL/day (mean of paired samples). Higher urine volume was sustained for 1 year in the high water-intake group (B).

