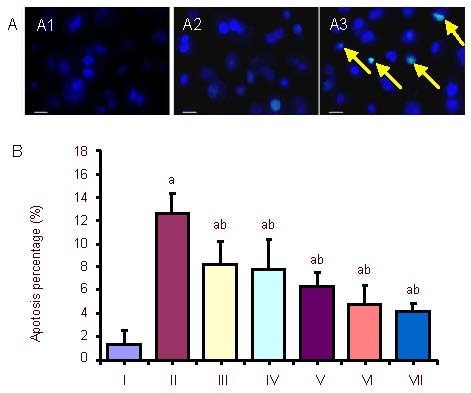
Figure 2.

Morphological changes and rate of apoptosis in PC12 cells after oxygen-glucose deprivation (OGD) and exogenous Activin A treatment at different concentrations.
(A) Morphological changes in PC12 cells treated with exogenous Activin A plus OGD. Morphologic changes of condensed or fragmented nuclei were considered to be markers of apoptosis. The nuclei of cells in the control group (A1) were ellipse in shape and stained light blue, with little apoptosis. In the 6-hour OGD group (A2), apoptotic cells were observed to be shrunken and hyperchromatic. In the exogenous Activin A + OGD group, apoptotic cells (arrows) decreased compared with the OGD group (Hoechst 33342 fluorescence staining). Scale bars: 50 μm.
(B) Rate of apoptosis in PC12 cells. The rate of cell apoptosis in the OGD group was significantly higher than that in the control group. Treatment with exogenous Activin A for 24 hours resulted in reduced damage of cells compared with the OGD group. The percentage of apoptosis following Hoechst 33342 staining was inversely correlated to the concentration of exogenous Activin A. Five fields were chosen randomly, and 200 cells were counted in each field to obtain the rate of apoptosis. Data are expressed as mean ± SD. One-way analysis of variance was used to compare mean values. aP < 0.05, vs. control group; bP < 0.05, vs. OGD 6 h group.
I: Control; II: OGD 6 h; III: Activin A 10 ng + OGD 6 h; IV: Activin A 20 ng + OGD 6 h; V: Activin A 30 ng + OGD 6 h; VI: Activin A 50 ng + OGD 6 h; VII: Activin A 100 ng+ OGD 6 h; h: hours.
