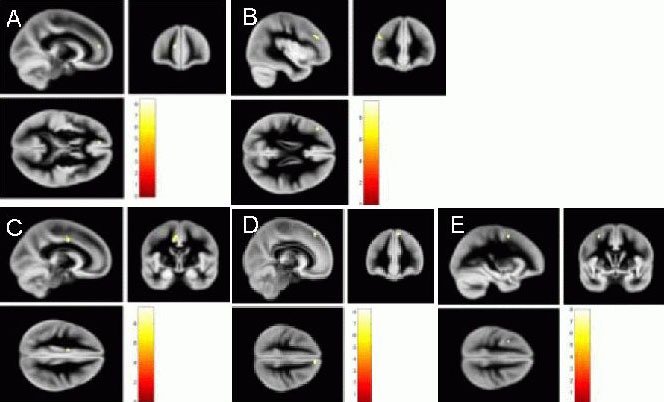
Figure 1.

Gray matter atrophy in relapsing-remitting multiple sclerosis patients by MRI.
Voxel-based morphometric analysis showed that the volume of the gray matter in the multiple sclerosis group was significantly reduced compared with the healthy control group. Map of yellow dots represents significant parts of gray matter atrophy. The atrophy was most significant in the cingulate and frontal cortices of the dominant hemisphere. The atrophic brain regions in the automated anatomical labeling template included the following lobes: Cingulum_Mid_L (A): Median cingulate and paracingulate gyri left; Frontal_Sup_Medial_R (B): Superior frontal gyrus, medial right; Frontal_Inf_Tri_L (C): Inferior frontal gyrus, triangular part left; Frontal_Mid_L (D): Middle frontal gyrus left, and Frontal_Sup_Medial _L (E): Superior frontal gyrus, medial left.
