
Figure 2.
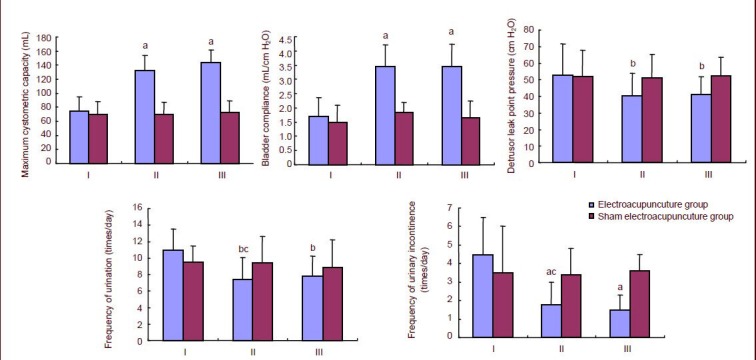
Results of urodynamic testing before and after electroacupuncture and sham electroacupuncture.
Data are expressed as mean ± SD. Intergroup differences were compared using the two-sample t-test for groups with unequal variance, and intragroup differences were compared using the paired t-test. aP< 0.01, bP< 0.05, vs. control group; cP< 0.05, vs. before electroacupuncture. 1 cm H2O = 0.098 kPa.
I: Before electroacupuncture; II: after electroacupuncture; III: 3 months after electroacupuncture.