
Figure 12.
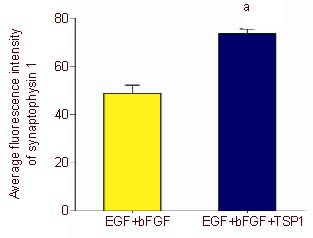
Expression of synaptophysin 1 after induction of bone marrow mesenchymal stem cells.
Five visual fields in each group were randomly selected to detect the fluorescence density using Image Pro Plus 6.0 software, and the average absorbance values of synaptophysin 1 after induction were calculated. aP < 0.05, vs. epidermal growth factor (EGF) + basic fibroblast growth factor (bFGF) group (two samples t-test). Data are represented as mean ± SD, n = 5.