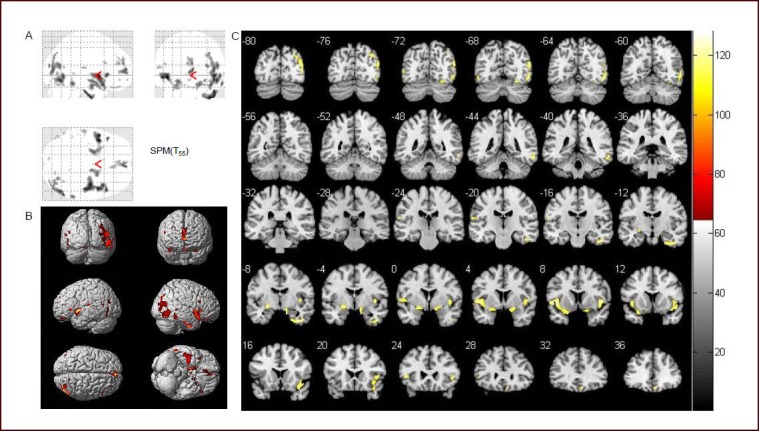
Figure 1.

Statistical parameter map (two-sample t-test) of gray matter volume between patient (n = 32) and control (n = 25) groups (volume of gray matter was reduced in the patient group).
(A) Three-dimensional brain images of comparison between patient and control groups. Shadow represents atrophic brain areas in Parkinson's disease patients.
(B) Three-dimensional coronal image in MNI standard coordinate of statistical analysis results using pseudo-color. The pseudo-color represents atrophic brain areas in the patient group.
(C) Coronal template map in MNI standard coordinates of the statistical analysis results using pseudo-color. Shadow and color represent atrophic brain areas in the patient group. MNI: Montreal Neurological Institute.
