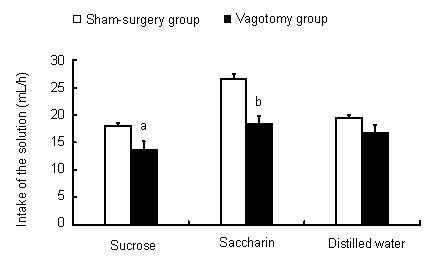
Figure 1.

Comparison of solution intake (mL/hour) between vagotomy and sham-surgery groups for each solution.
The intake of each solution during a period of 1 hour was measured daily, and this measurement was continued for 7 days. The value is the average daily intake during this 1-hour period and is expressed as mean ± SEM of six animals for each group. aP < 0.05, bP < 0.01, vs. sham-surgery group using an independent sample t-test.
