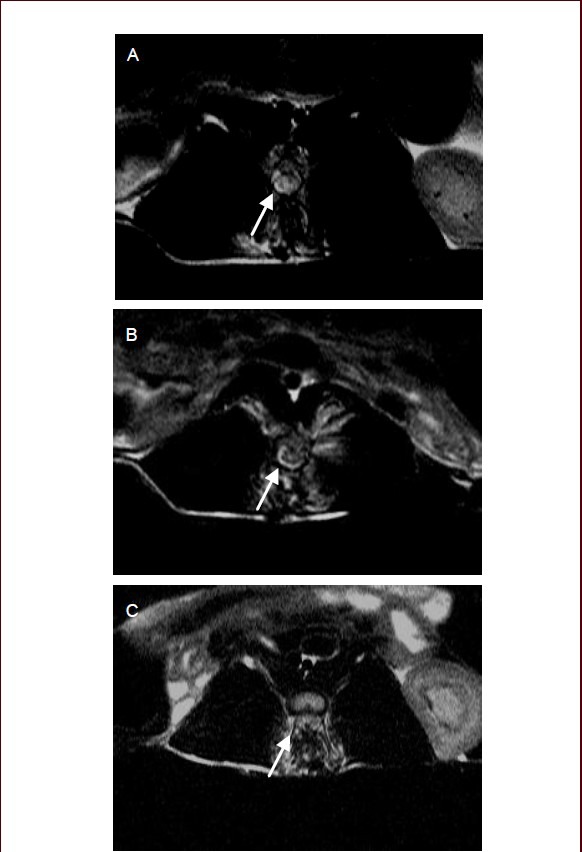
Figure 5.

T2-weighted images of the spinal cord injury region after cell transplantation.
(A) At 7 days after cell transplantation, a small number of dot-shaped low signal intensity shadows were present in the spinal cord injury region; (B) at 14 days after cell transplantation, the low signal intensity shadows increased in number compared with that at 7 days after cell transplantation; (C) at 21 days after cell transplantation, low signal intensity shadows were reduced in number. Arrows point to dot-shaped low signal intensity shadows.
