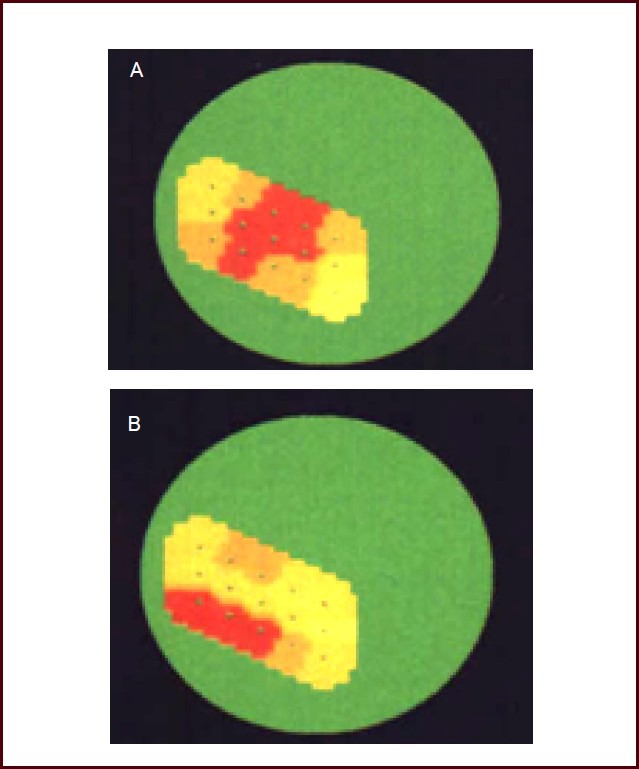
Figure 4.

Volunteer's topographical map of evoked potential in the cortical somatosensory area I.
(A) Topographical map of volunteers without propagated sensation along the meridian. A clear high potential reaction was confined to the representative area of the upper limb (red section).
(B) Topographical map of volunteers with significant propagated sensation along the meridian. A high potential reaction covered the representative area of the upper limb, and extended to the face representative area (red area reflects the representative area of the upper limbs, head, and face).
The color from blue, green, light yellow, yellow, red, to dark red reflects the reaction process of the cortical potential from low to high.
