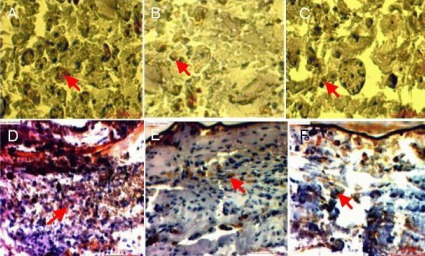
Figure 6.

Stained images of sciatic nerve samples expressing cellular markers S-100 (A–C) and glial fibrillary acidic protein (GFAP; D–F) harvested from autograft (A, D), polymeric film conduit (B, E) and nanofibrous conduit groups (C, F).
Arrows indicate S-100-positive Schwann cells and GFAP-positive glial cells, respectively (scale bar: 10 μm for S-100, 20 μm for GFAP).
