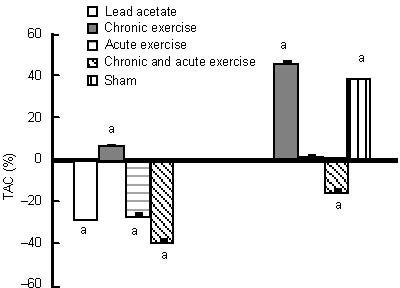
Figure 2.

Effects of chronic and acute treadmill exercise on plasma total antioxidant capacity (TAC) in rats exposed to lead acetate.
The data in the left diagram are expressed as the percentage of plasma TAC levels in lead acetate, chronic or/and acute exercise groups relative to the sham group. The data in the right diagram are expressed as the percentage of plasma TAC levels in the chronic or/and acute exercise, and sham groups relative to the lead acetate group. aP < 0.05 (one-way analysis of variance).
