Figure 2.

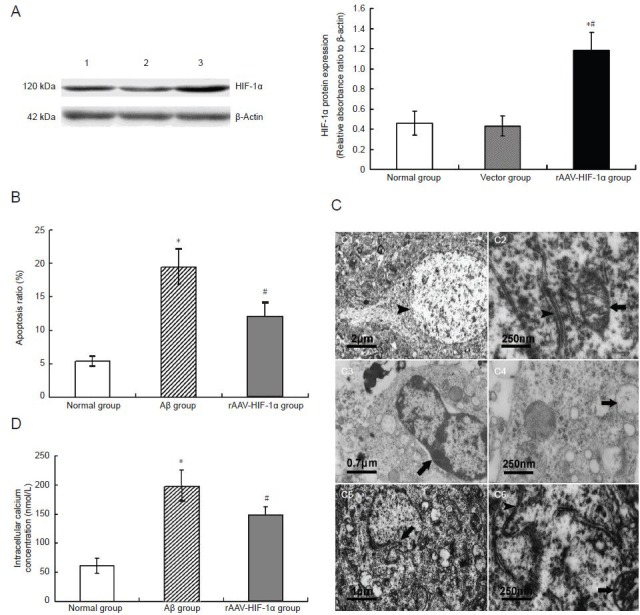
rAAV-HIF-1α expresses HIF-1α protein efficiently in primary cultured hippocampal neurons and inhibits Aβ25-35-induced apoptosis of hippocampal neurons.
(A) HIF-1α expression in rAAV-HIF-1α-transduced primary hippocampal neurons. HIF-1α expression was detected by western blot assay. 1: Normal group; 2: vector group; 3: rAAV-HIF-1α group. *P < 0.05, vs. normal group. #P < 0.05, vs. vector group.
(B) Effect of rAAV-HIF-1α transduction on apoptosis induced by Aβ25-35 in primary hippocampal neurons. Proportions of apoptotic hippocampal neurons were detected by flow cytometry. *P < 0.05, vs. normal group; #P < 0.05, vs. Aβ group.
(C) Effect of rAAV-HIF-1α transduction on ultrastructural changes determined by transmission electron microscopy in primary hippocampal neurons induced by Aβ25-35. (C1, 2) Normal group, hippocampal neuronal chromatin (arrow) is well-distributed (C1), endoplasmic reticulum smooth and continuous (arrowhead), and mitochondrial (MT) cristae (arrow) clearly visible (C2). (C3, 4) Aβ group, hippocampal neurons show striking apoptotic changes involving chromatin condensation (arrow) into compact patches with peripheral migration (C3), disintegration of the contents of cytoplasmic organelles (including endoplasmic reticulum and mitochondria) into non-visible membranous debris, non-descript particulate matter, or vacuoles (arrow) (C4). (C5, 6) rAAV-HIF-1α group, hippocampal neurons show only slight morphological changes associated with apoptosis e.g. nuclear envelope blebbing (arrow) (C5), while the cytoplasmic organelles, e.g. endoplasmic reticulum (arrowhead) and mitochondria (arrow), are relatively normal (C6). Bars: (C1) 2 μm; (C2, 4, 6) 250 nm; (C3) 0.7 μm; and (C5) 1 μm.
(D) Effect of rAAV-HIF-1α transduction on [Ca2+]i in primary hippocampal neurons induced by Aβ25-35. [Ca2+]i in hippocampal neurons was determined by laser scanning confocal microscopy using Fluo-3/AM as the fluorescent dye. *P < 0.05, vs. normal group; #P < 0.05, vs. Aβ group.
(A, B, D) Results are expressed as mean ± SD (n= 6). Differences between mean values of two groups were assessed by one-way analysis of variance and independent samples t-tests.
rAAV: Recombinant adeno-associated virus; HIF-1α: hypoxia-inducible factor 1α; Aβ: amyloid-beta protein.
