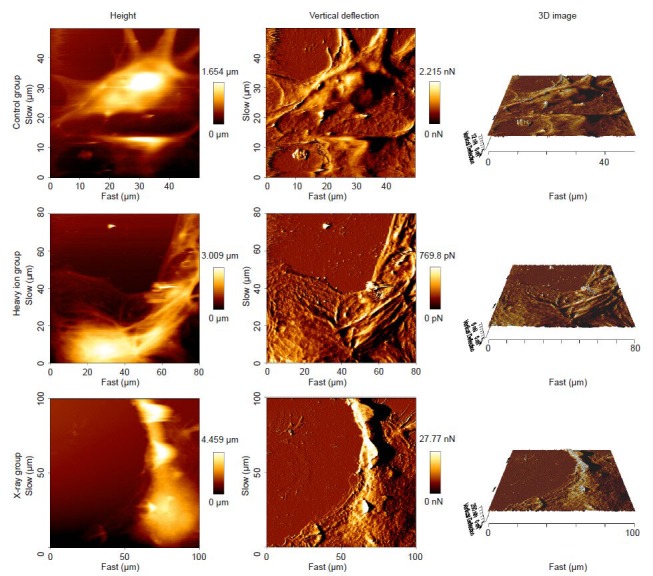
Figure 4.

Surface topography of cortical neurons after heavy ion beam or X-ray irradiation (atomic force microscope).
The height graph (left panel): The various colors indicate varying cell heights. Vertical deflection graph (middle panel): The deflection information from the probe during the scanning was recorded to reflect the surface topographical features of the cells, which is more accurate than the height graph. 3D image (right panel): Intuitively reflects the changes in the cell surface. Slow and fast refer to the length and width of the scanning region, respectively.
