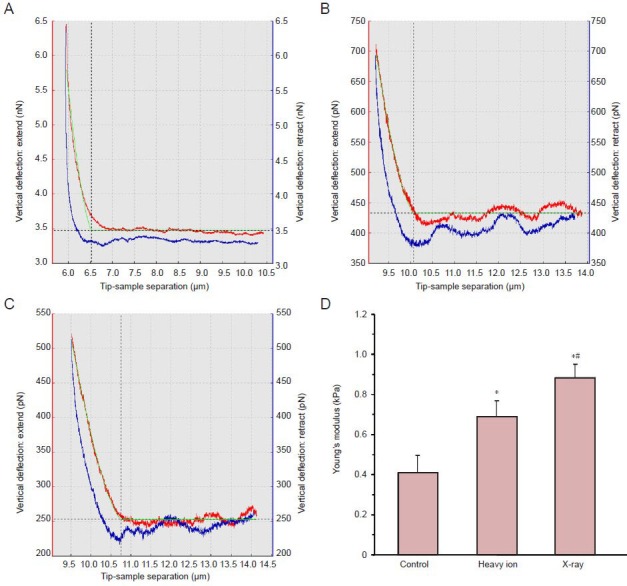
Figure 5.

Young's modulus for cortical neurons after heavy ion beam or X-ray irradiation.
(A–C) The force curve for neurons at 24 hours after irradiation detected using an atomic force microscope in contact mode. (A) Control group; (B) heavy ion group; (C) X-ray group. The red curve is the extended curve and the blue curve is the withdrawn curve. The green curve on the red curve was the results of fitting the calculation results of cell elasticity. (D) Data are expressed as mean ± SD. One-way analysis of variance and two samples t-test were applied for comparison between the groups. *P < 0.01, vs. control group; #P < 0.01, vs. heavy ion group.
