
Figure 8.
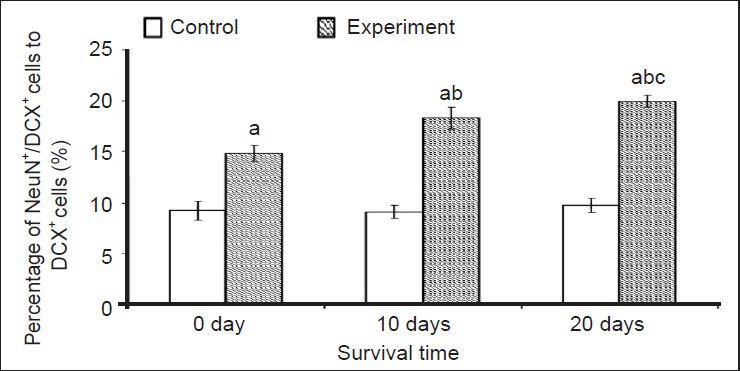
Effect of environmental enrichment exposure on the ratio of NeuN/doublecortin (DCX) double-positive cells in layer II of the medial prefrontal cortex in guinea pigs.
Data are represented as the ratio of NeuN/DCX double-positive cells to DCX-positive cells. The difference between the environmental enrichment group and the control group at the same time point was compared using unpaired t-test. Data are expressed as mean ± SD of eight guinea pigs in each group at each time point (one-way analysis of variance and Duncan's multiple range test). aP < 0.01, vs. control group at the same time point; bP < 0.01, vs. environmental enrichment expo-sure group at 0 day; cP < 0.01, vs. environmental enrichment exposure group at 10 days.