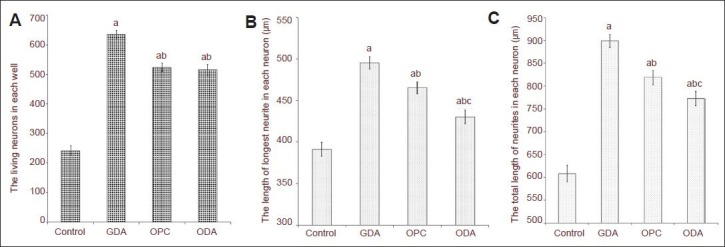
Figure 4.

The number of living cells and the length of processes of dorsal root ganglion neurons co-cultured with various cells for 18 hours.
(A) Number of living neurons in each well in each group (cells double-stained with NF-M and Hoechst 3442). (B) Length of the longest processes of neurons in each group. (C) Length of all processes of neurons in each group. GDA: Type-1 astrocytes; OPC: oligodendrocyte precursor cells; ODA: type-2 astrocytes. Under the fluorescence microscope, neurons were observed, photographed, and quantified, and the number of living neurons was measured. The length of neuronal processes was measured using NIS-ELEMENT BR software self-contained by the microscope. The data are expressed as mean ± SD. Mean value of multiple groups was compared using one-way analysis of variance. Multiple comparisons among mean values were done using the Duncan's multiple range test. aP < 0.01, vs. blank control group; bP < 0.05, vs. type-1 astrocyte group; cP < 0.05, vs. oligodendrocyte precursor cell group.
