
Figure 6.
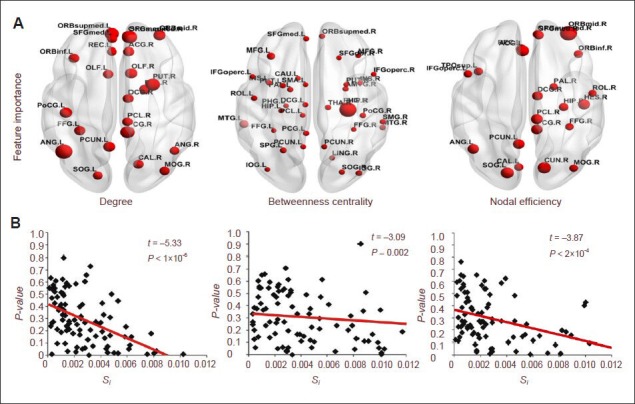
Correlation analysis of statistical significance and importance of features in brain regions.
(A) Brain regions showing an importance of feature greater than 0.004. The size of dots represents the value of the feature's importance. The bigger the dot is, the greater the value is.
(B) Correlation analysis of statistical significance and the importance of features. Data are analyzed using regression analysis. Red lines represent the regression lines. Spectrum adopts ICBM 152 and images are plotted using BrainNet (http://www.nitrc.org/projects/bnv/). Si indicates the importance of features (supplementary Text 1 online).