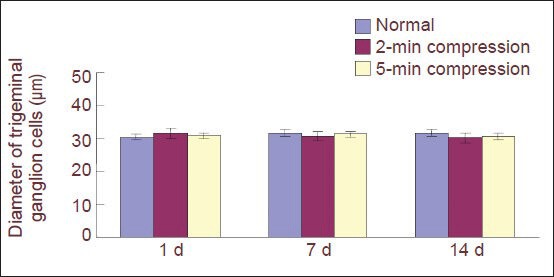
Figure 2.

Effect of percutaneous microballoon compression on the diameter of trigeminal ganglion cells.
Data are expressed as mean ± SD. There are two, three and three rabbits, respectively, in the normal, 2-minute (min) compression and 5-min compression groups at 1, 7, 14 days (d) after percutaneous microballoon compression. No significant difference in diameter was observed among the 2-min compression, 5-min compression and normal groups (P> 0.05) using one-way analysis of variance.
