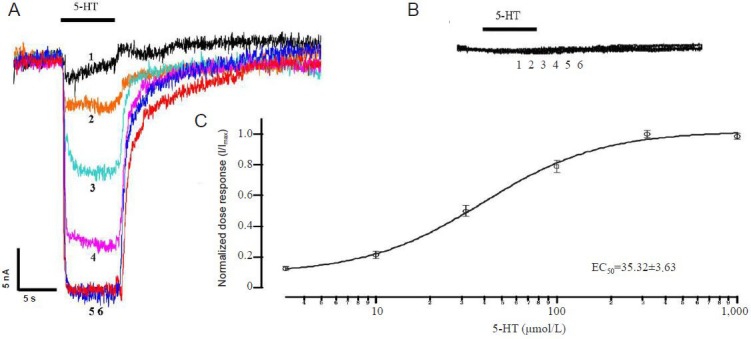
Figure 1.

Expression of human brain serotonin transporter (SERT) in Xenopus oocytes.
(A) Dose-response curves for varied serotonin concentrations (3.16–1,000 μmol/L) on SERT channels. (B) No serotonin response in control oo-cytes injected with water. (C) Normalized serotonin dose response on SERT channels. The half-maximal effect (EC50) was observed at a concentra-tion of 35.52 ± 3.63 μmol/L. Data are expressed as mean ± SEM. Each experiment was repeated six times. I: Current intensity; Sweeps 1–6: 3.16, 10, 31.6, 100, 316, and 1,000 μmol/L serotonin (5-HT).
