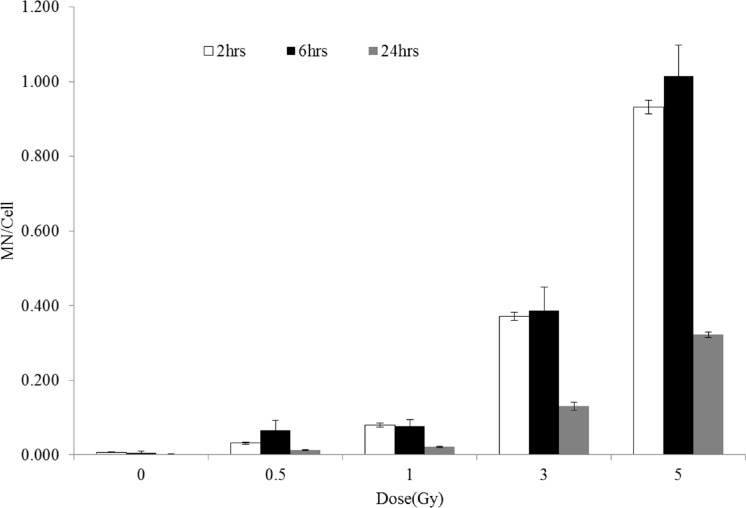
FIGURE 2.
The MN frequency obtained from the blood samples irradiated to 60Co gamma rays (0.5, 1, 3 and 5Gy) and culture initiated after two, six and twenty four hours. Each bar represents the mean ± SE of the MN for two independent experiments (N=2). Significance levels of twenty four hours MN yield showed P < 0.05 (*) were indicated in the test bars compared to two and six hours.

