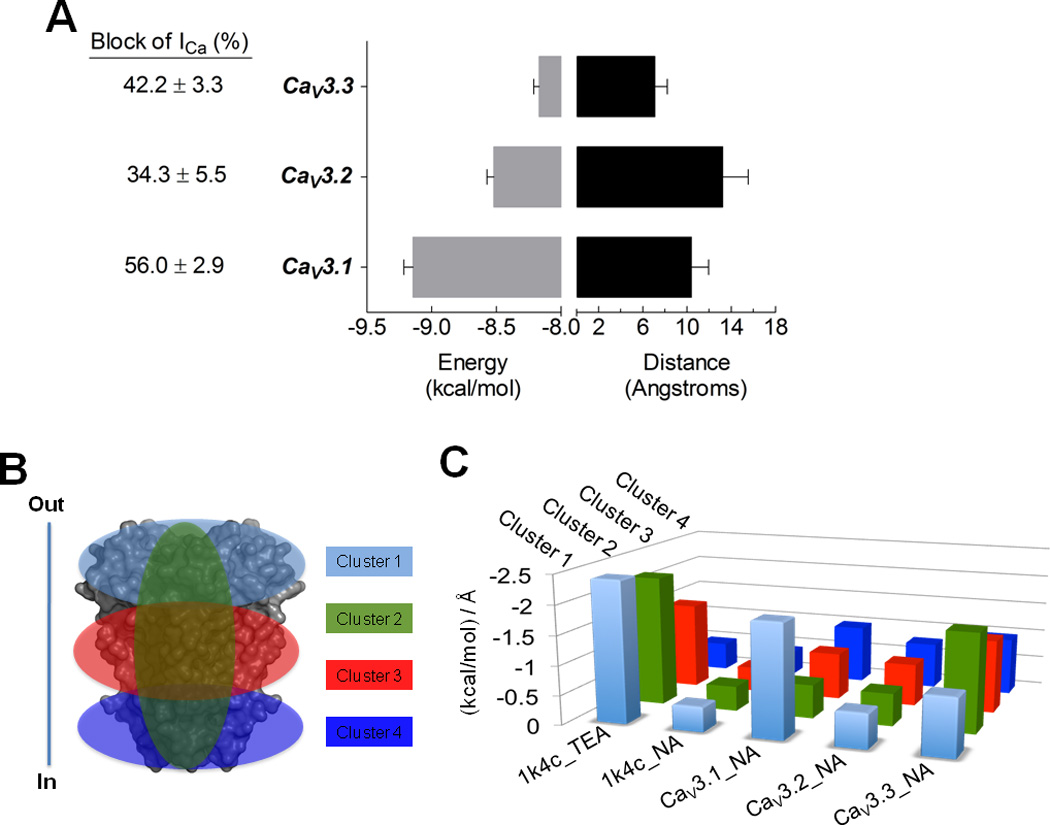
Fig. 11. Niflumic acid docking to CaV3 channels.

A) Average binding energies (kcal/mol) and distance (in Å, Angstroms), for niflumic acid (NA) as ligand docked to CaV3 pore domain models. Distance data was obtained from RMSD l.b. values, which is the relative value to the best mode using only movable heavy atoms or lower bound. Columns are averages of the minimum or best binding energy for the docking results. The 1K4C coordinates were used as control for the interaction with TEA. NA docked with 1K4C showed a low interaction value (~ −0.4), serving as low affinity control. Error bars represent SEM from n = 36 interaction models of each CaV3 channel. B) Docking analysis was clustered as shown, in order to search the whole grid spacing of the protein models and control structures. In and Out denote the intra and extracellular side of the cell. C) The ratio between kcal/mol and RMSD l.b. (in Å) for each cluster are illustrates as follows: cluster 1, clear blue, involves the upper region of the proteins; cluster 2, green, the pore; cluster 3, red, the middle transmembrane region of the proteins; and cluster 4, dark blue, the intracellular region of the protein.
