Fig. 4.
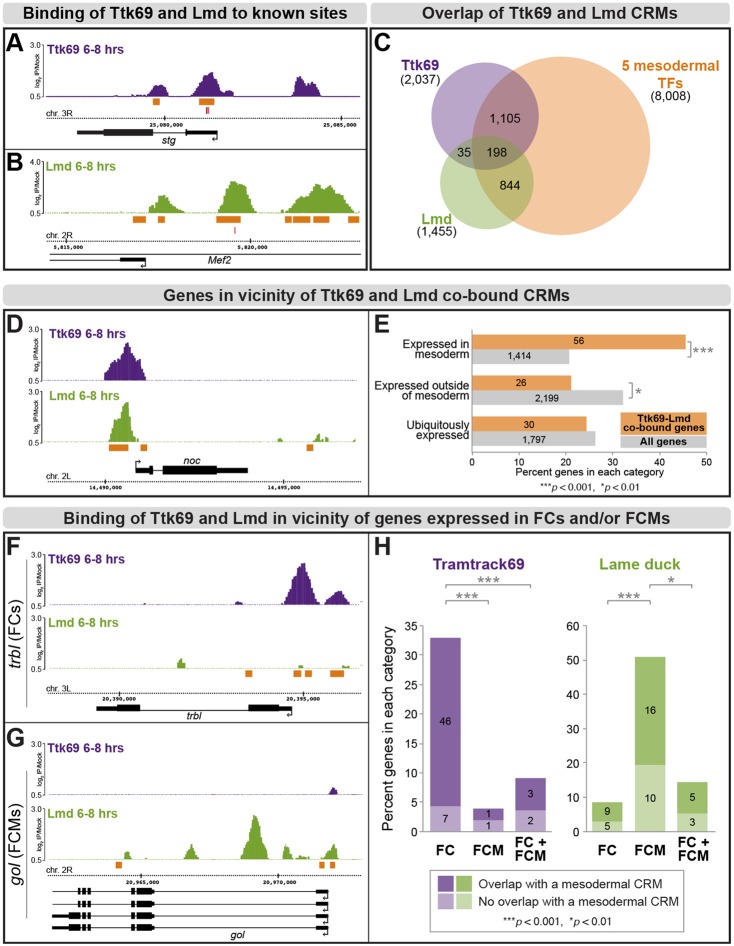
Genome-wide Ttk69 and Lmd binding activity. (A,B) Binding profiles [normalized log2 ChIP signal (IP/mock)] of Ttk69 (A, purple) and Lmd (B, green) in loci of their known target genes stg and Mef2, respectively. Mesodermal CRMs in orange and experimentally validated binding sites in red. (C) Venn diagram showing overlap of regions bound by Ttk69 (purple), Lmd (green) or five key mesodermal TFs (orange). (D) Locus of a representative mesodermal gene, noc, with Ttk69 (purple) and Lmd (green) ChIP signal (log2 IP/mock) and mesodermal CRMs (orange) upstream of its TSS. (E) BDGP database survey of expression of genes associated with 233 Ttk69-Lmd co-bound CRMs. Orange indicates genes with at least one Ttk69-Lmd co-bound CRM in their proximity and gray designates all genes annotated by BDGP. The gene numbers are indicated. (F,G) Ttk69 (purple) binds to the FC-specific gene trbl (F) and Lmd (green) occupies multiple CRMs in the locus of gol, an FCM-specific gene (G). (H) Global analysis of Ttk69 and Lmd binding preferences within 1.5 kb of TSS of differentially expressed genes. Dark purple and green represent genes with at least one CRM overlapping a mesodermal CRM; light colors indicate genes where CRMs do not overlap mesodermal CRMs. P-values calculated using Fisher's exact test.

