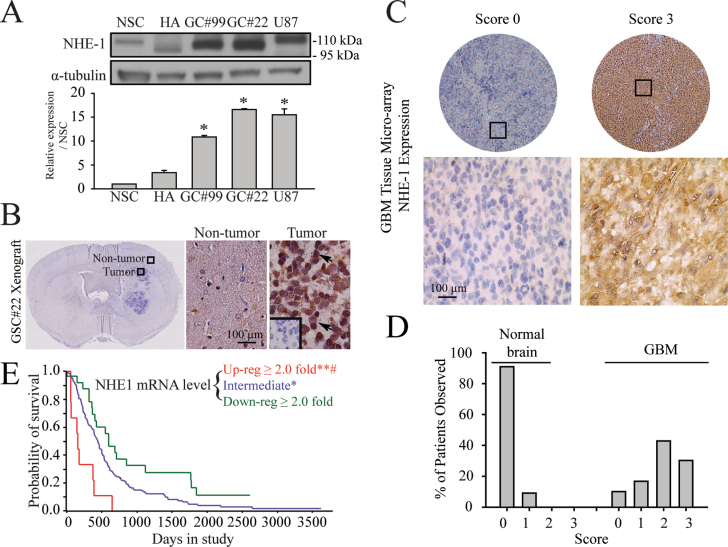
Fig. 1.
Abundant expression of NHE1 proteins in GC. (A) Upper panel: representative immunoblotting showing the expression of NHE1 protein in human NSCs, HAs, primary glioma cell lines (GC#99 and GC#22) or GBM cell line U87. Lower panel: summary data of immunoblotting. Expression of each protein was first normalized by α-tubulin and relative expression level in each cell type was then normalized to NSC. Data are mean ± SEM. n = 3. *P < 0.05 versus NSC. (B) Representative immunohistochemistry staining of NHE1 in xenograft brain tissues of structured clinical interview for DSM mouse derived from glioma stem cell (GSC#22). Arrow: representative cells positively stained for NHE1 protein. Inset: negative control with primary antibody omitted. (C) Representative images of NHE1 immunohistochemistry with different intensity in a tissue microarray of GBM. Rabbit anti-NHE1 was used to label the tissue microarray. Each punch was subjectively scored for negative (score 0), mild (score 1), moderate (score 2) and strong (score 3) of NHE1 expression by light microscopic visualization of intensity of cytoplasmic diaminobenzidene. Nuclear or fibrillary labeling was not scored as positive. In cases of multiple punches/cores for one patient tumor sample, the score given represented the most frequent expression level. Upper panel: examples of score 0 and score 3 NHE1 labeling from the GBM tissue microarray. Black boxes indicate magnified sections in subsequent panels. Lower panel: high magnification photomicrograph of the region in the black box. (D) Summary data of different NHE1 expression scores in normal or GBM tissues as described in Materials and methods. Data are mean ± SEM. n = 3. *P < 0.05 versus normal brain. (E) Kaplan–Meier survival probability curve for patients from Repository for Molecular Brain Neoplasia Data with differential NHE1 expression. The red, blue and green lines indicate the survival of patients with GBMs of upregulated, intermediate and downregulated NHE1 expression, respectively. *P < 0.05 and **P < 0.001 versus downregulated GBMs. # P < 0.01 versus intermediate GBMs.

