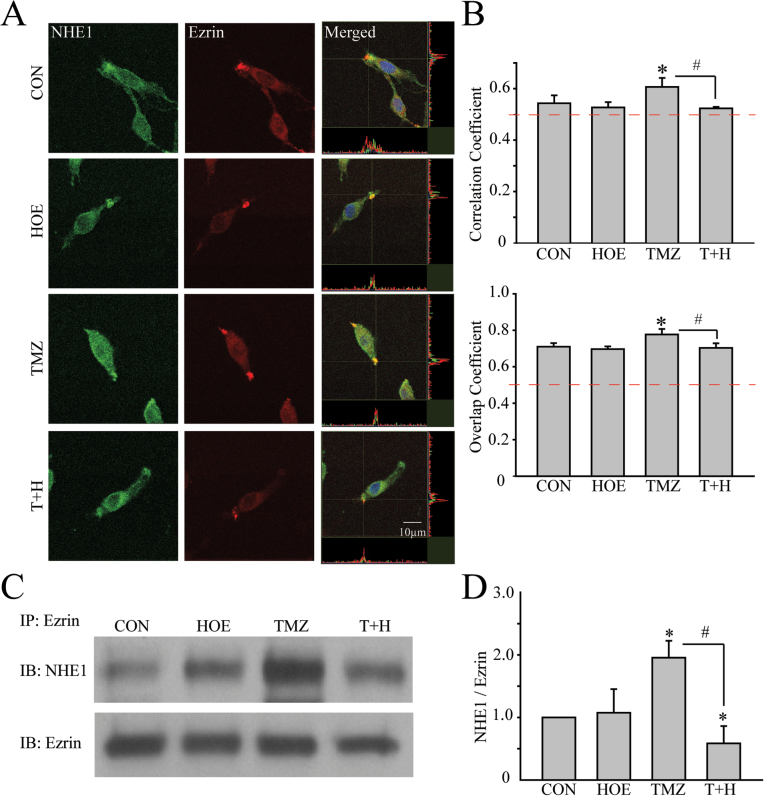
Fig. 4.
Direct interactions between NHE1 and ezrin in GC. (A) Representative images showing expression of NHE1 (green) and ezrin (red) in GC#22 under four different conditions. Cells were exposed to CON, 1 µM HOE-642 (HOE), 100 µM TMZ or 100 µM TMZ plus 1 µM HOE-642 (T+H) for 48h. Immunosignals of NHE1 and ezrin proteins were colocalized at the lamellipodia (merged images). Colocalization of NHE1 and ezrin was analyzed using Image J software with the Colocalization Indices plugin (50). The Pearson’s correlation coefficient and overlap coefficient were used as indices of the frequency of colocalization between NHE1 and ezrin as described previously (16). Pearson correlation coefficient was calculated using online statistics software (http://www.wessa.net/, Free Statistics Software, Office for Research Development and Education, version 1.1.23-r7). (B) Summary data of correlation coefficient and overlap coefficient in four different treatment groups. Data are mean ± SEM. n = 5. *P < 0.05 versus CON. # P < 0.05 versus TMZ. (C) Representative immunoblots showing coimmunoprecipitation of ezrin and NHE1 protein was detected in GC#22 using anti-ezrin antibody. (D) Summary data of immunoprecipitation. Expression of NHE1 protein was first normalized by ezrin in each sample. Relative expression level in each group was normalized to CON. Data are mean ± SEM. n = 4. *P < 0.05 versus CON. # P < 0.05 versus T+H.

