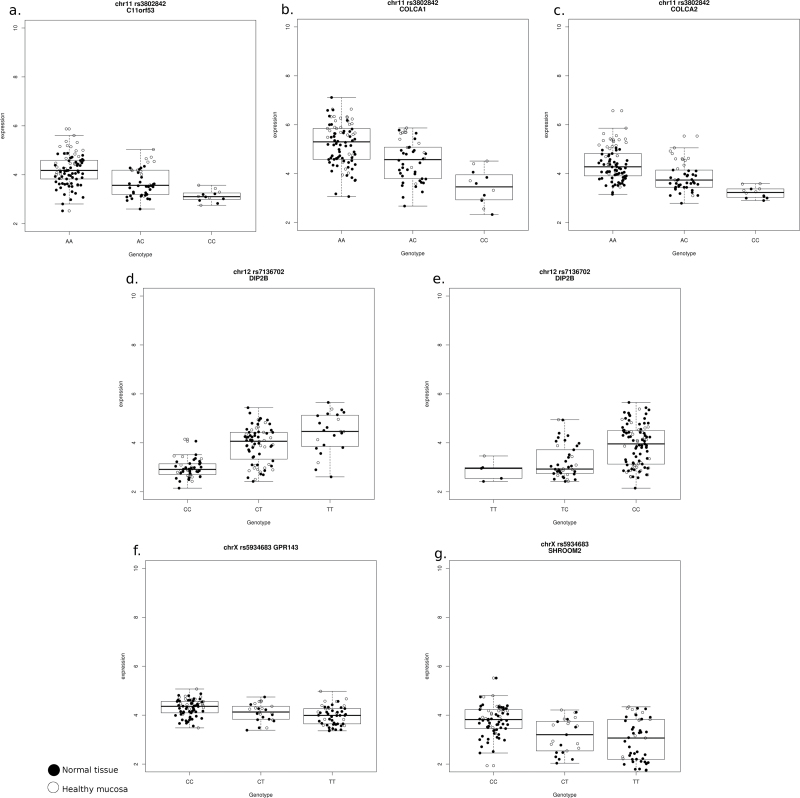
Fig. 1.
Box-plot of cis-eQTL for significant associations analyzed in normal colon. White dots indicate healthy colonic mucosa and black dots indicate adjacent normal mucosa from patients. The y-axis shows the normalized (log2) mRNA expression level for the gene calculated from the U219 Affymetrix array.

