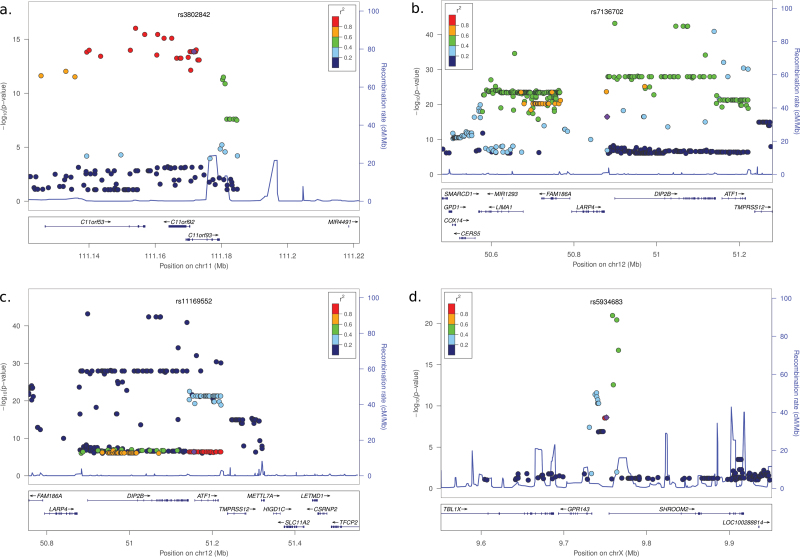
Fig. 2.
Detailed distribution of the SNPs for loci 11q23.1, 12q13.12 and Xp22.3. Each dot represents a SNP. The purple dot indicates the GWAS SNP. For other SNPs the colors indicate the LD r 2 respect the GWAS SNP. The left y-axis indicates the −log(P value) from the association of the SNPs with the expression of the identified gene. The right y-axis indicates the recombination rate, represented with a blue line in the graph. The figure was generated with LocusZoom (46).

