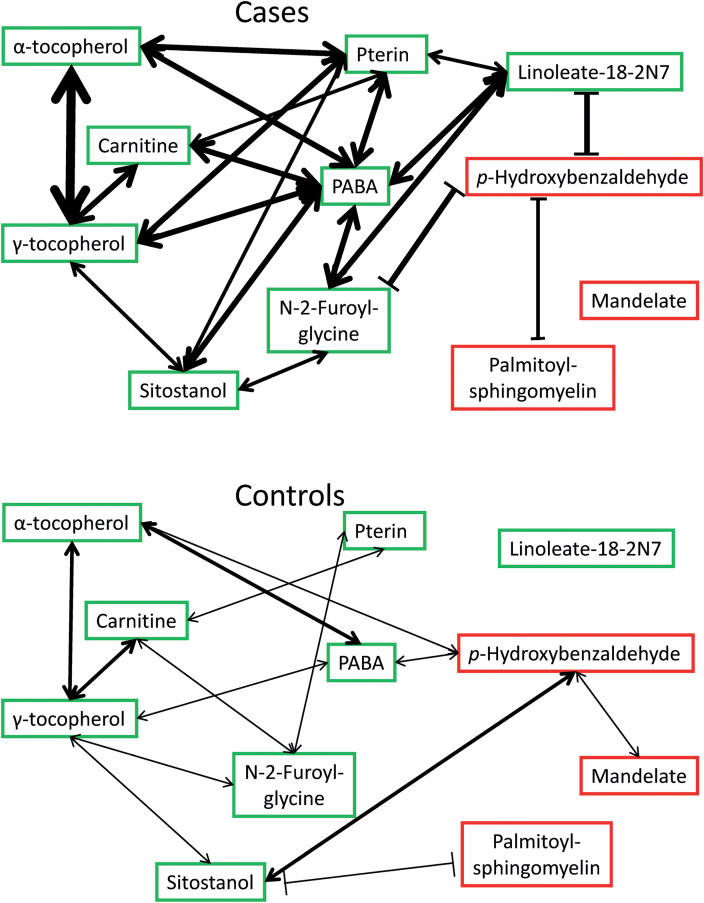
Fig. 3.
Pairwise correlations of 11 CRC-associated metabolites in feces of CRC cases (above) and matched controls (below). Double-headed arrows (↔) indicate direct (positive) correlations; blocked lines (|―|) indicate inverse (negative) correlations. Green indicates inverse correlation with CRC; red indicates direct correlation with CRC. Line weight indicates strength of correlation coefficient. Cases’ metabolites are generally more correlated than controls’ metabolites. Mean normalized levels of these metabolites are presented in Figure 2.

