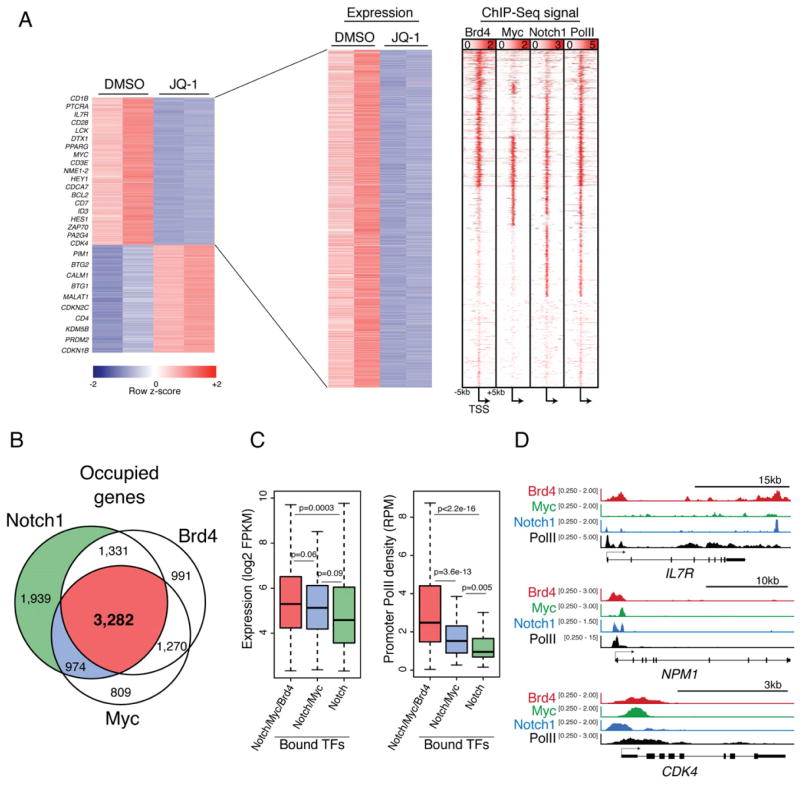
Figure 7. BRD4 inhibition reduces expression of genes expressed in leukemia initiating cells directly co-regulated by MYC and NOTCH1.
(a) Heat maps showing genes significantly downregulated upon treatment of CUTLL1 cells with JQ-1 (400nM) for 12 hr compared to vehicle treated as determined by high throughput RNA sequencing (RNA-seq). Each column represents a biological replicate. ChIP-Seq signal density heat maps (right) show Brd4, c-Myc, Notch1, and total RNA PolII at gene loci depicted in gene expression heatmap. Genes are clustered based on Brd4, cMyc and Notch1 signal density. Scale represents reads per million (RPM) (b) Ven diagram showing overlap of total genes bound by Brd4, c-Myc and Notch1 in CUTLL1 cells. (c) Box plots showing Log2FPKM values (left) or promoter PolII density (right) for genes bound by combinations of Brd4, Myc and Notch. Whiskers represent upper and lower limits of the range. Boxes represent the first and third quartile with the line representing the median. (d) Representative ChIP-seq tracks for three gene loci: IL7R, NPM1 and CDK4. Scale corresponds to RPM.

