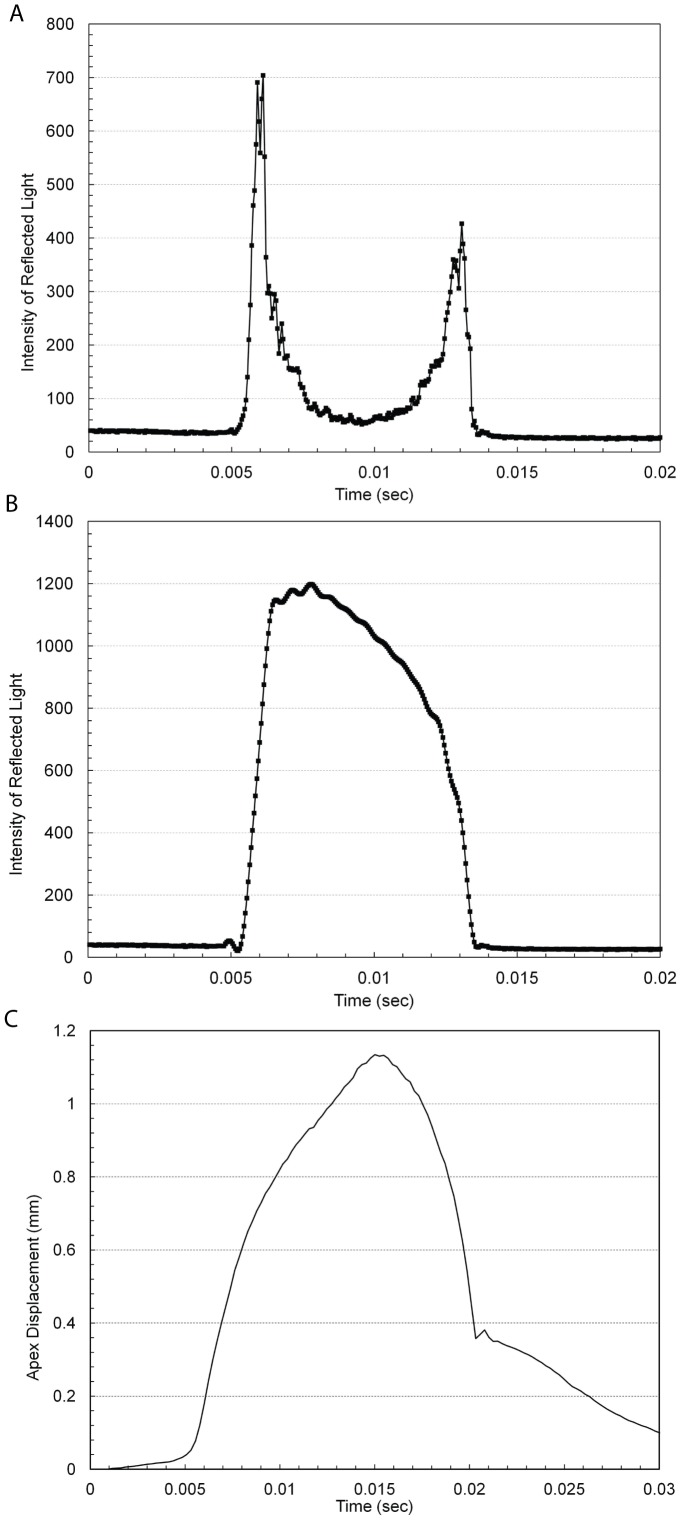
Figure 1. Waveforms reported by Ocular response analyzer (ORA) and Corvis-ST: (a) Example of ORA waveform.
The two peaks represent the instant the cornea becomes flat during the forward and backward motion of the cornea; (b) the same OA waveform now inverted about the straight line joining the two peaks in figure 1a; (c) Example of the apex displacement in mm measured by CoST.

