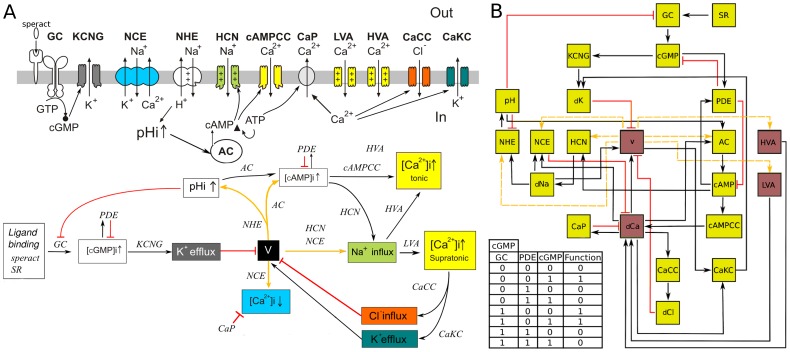
Figure 1. Speract-activated [Ca 2+] signaling pathway network model.
A) Upper part: Schematic representation of the components of the signaling pathway triggered by speract in the sperm flagellum. Arrows traversing the membrane show ion fluxes. Arrows within the cell are indicative of causal relations. B) Bottom part: Signaling pathway operation diagram, black arrows correspond to activation, red lines to deactivation and yellow arrows can be activating or inhibitory depending on the relative state of the pathway elements being interconnected. Once speract binds to its receptor the several feedback loops are triggered according to the nature of the links involved. The concatenation of these loops leads to oscillatory stages of the whole pathway. The color code identifies corresponding upper and lower part components. Current models propose that the binding of speract to its receptor promotes the synthesis of cGMP that activates K+ selective and cyclic nucleotide-gated channels (KCNG) leading to membrane potential (V) hyperpolarization [3], [4], [7]–[11], [18]. This V change first induces an intracellular pH increase via a Na+/H+ exchanger (NHE) activation, [18], [51], [52], stimulates hyperpolarization-activated and cyclic nucleotide-gated channels (HCN) [53]–[55], removes the inactivation of voltage-gated  channels HVA and LVA [18], [56] (CaV), and facilitates
  extrusion by Na+/Ca2+ exchangers (NCE) [51], [52]. The opening of HCN and the influx of Na+ contribute to V depolarization, and concomitant increases in
  and
and  further depolarize V. It has been proposed that the
  increases could lead to the opening of
  -regulated Cl
 channels (CaCC) and/or
  -regulated K+ channels (CaKC), which would then contribute to hyperpolarize the V again, removing inactivation from CaV channels and opening HCN channels, [3], [4], [18]. It is thought that this series of events is then cyclically repeated generating a sequence of V-dependent turns. B) Network model of the signaling pathway. The network can be envisaged as a circuit where each node represents an element of the pathway and links, either in the form of arrows or lines, correspond to connections determined in the bottom part of (A). The activating or inhibitory nature of the yellow lines depends on the value of voltage (V). Yellow nodes represent binary nodes (0,1), and the four brown nodes are ternary nodes that can take values 0, 1 and 2. Changes in the node states are determined by the connected nodes by means of a regulatory function (or truth table). As an illustration we present the case of the cGMP shown at the bottom left of (B). The first 3 columns in this table contain all the possible activation states of the cGMP regulators: GC, which is an activator; PDE, an inhibitor and cGMP (cGMP is a self-regulator); the fourth column shows the values for the function that correspond to each combination of the regulators. Additional nomenclature note: Speract receptor (SR); guanylate cyclase (GC); unknown
  channels sensitive to cAMP (cAMPCC);
  pump (CaP); dCa, dCl, dNa, dK are abbreviations for permeability changes in [Ca2+], [Cl−], [Na+] and [K+], respectively.

