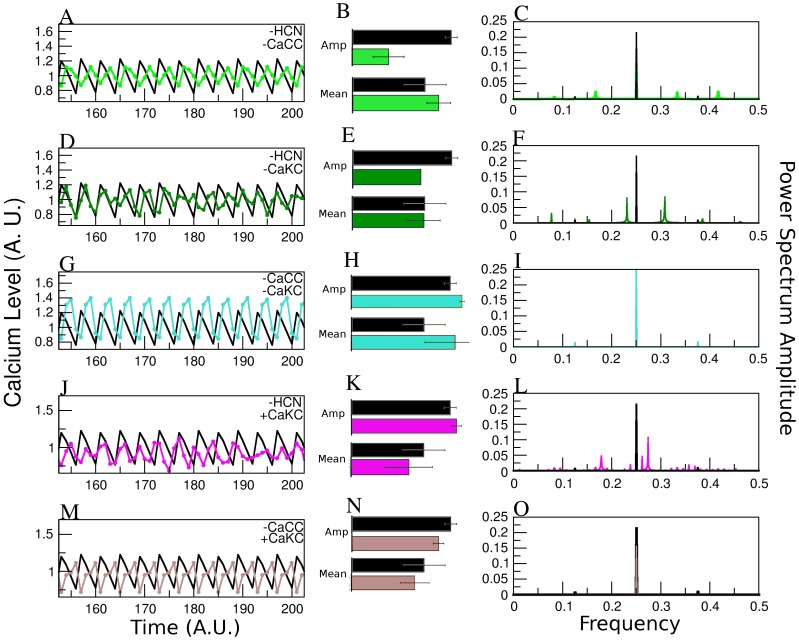
Figure 4. Effect on the Calcium dynamics of altering the different NFA-sensitive channels taken by pairs.
Average over 100,000 initial conditions of the steady-state  dynamics for the WT network is shown in black as in Figure 2. The columns are also distributed as in figure 2. A), B) and C) Blocking HCN and CaCC channels case (green line); D), E) and F) Blocking HCN and CaKC (dark green); G), H) and I) Blocking CaCC-CaKC (turquoise); J), K) and L) HCN blocked and CaKC activated; M), N) and O) CaCC blocked and CaKC activated. Notice that cases with HCN blocked produce non-regular [Ca2+] dynamics, opposite to the regularity generated by the CaCC blockage. Elimination of CaKC (scenario 1 in text) generates an elevation in [Ca2+] concentration compared with blockage of CaCC or HCN. Activation of CaKC (scenario 2) generates a decrease in
  and peak, but the temporal behavior is more elaborate.

