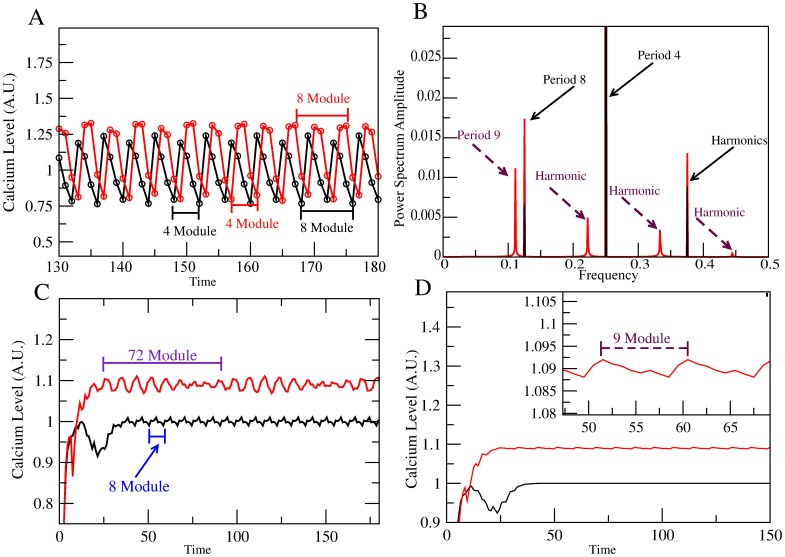
Figure 5. Effect of deletion of the three NFA-sensitive channels corresponding to scenario 1.
A) Steady state time evolution of  time series calculated as described in Fig 2. Average oscillations for the wild type are in black while oscillations under deletion of the CaCC-CaKC- HCN nodes are in red (the NFA-blocked network). For the wild type, two contiguous 4 element modules can be identified that together constitute a recurrent 8-step module. For the treated network different 4-step and 8-step modules are indicated in the figure. B) Fourier spectra calculated from 1000 steady-state steps of the
  time series shown in (A). Period 4 and 8 Fourier modes and their harmonics are shown in black. For the NFA-blocked network the spectrum shown in red, determined from 1000 points of the steady-state [Ca2+] time series, is richer due to the appearance of a period 9 Fourier mode with its harmonics, besides the period 8 contribution. C) A four element running average of the series corresponding to (A) including the initial transient time manifests an underlying repeated 8 module for the wild type and 72 module for the NFA-blocked network case. This last module is the minimum common multiple (MCM) of the period 8 and 9 Fourier modes shown in (B). For the wild type case, a period-8 module surfaces which is the MCM of the period 4 and 8 Fourier modes shown in (B). D) Result of performing a running average as in C) using an 8 element window instead. Here the wild type oscillations are wiped out (black graph) while a 9 module envelop (in red) is evidenced for the triply blocked NFA treated case. The insert is an amplification that shows this behavior in detail.

