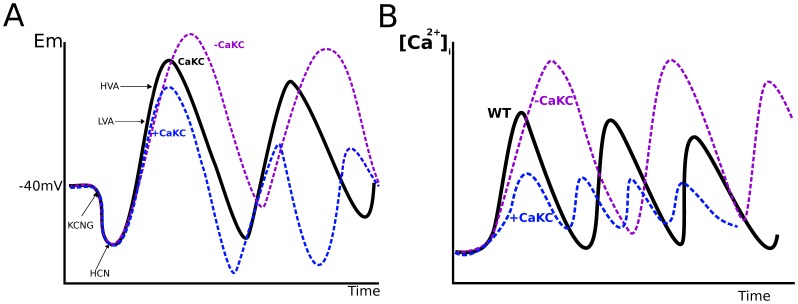
Figure 7. Schematic representation of the effect of deletion or activation of CaKC channels in the speract activated signaling pathway.
A) the membrane potential dynamics. B), the [Ca2+] dynamics. For (A) the membrane potential is depicted in black for the WT network after speract activation. Hyperpolarization (lower than −40 mV) due to a  efflux via the KCNG channel, and the consequent opening of the voltage-dependent HCN channel which in turn depolarizes the sperm flagellum are shown. Depolarization (higher than −40 mV) opens LVA and HVA [Ca2+] channels. The increase in
  enhances depolarization. This last entrance of [Ca2+] opens the CaCC and CaKC channels with the corresponding influx of
  and efflux of
  that hyperpolarize the membrane potential. All these steps are cyclically repeated causing the [Ca2+] oscillation pattern depicted in (B). If the effect of the drug is an inhibition of CaKC channels, this would cause a bigger depolarization, because a decrease in the
  efflux. This is shown in the purple curve, notice that the amplitude is bigger than in the WT case. If the effect on CaKC is an activation instead, a bigger hyperpolarization is produced, due to the increase in the efflux of
  . Depolarization takes less time and is smalles than in the WT case for the same reason (blue curve). For (B), the WT [Ca2+] dynamics is again depicted in black. Inhibition CaKC channels (purple curve), reduces the extrusion of
  diminishing hyperpolarization hence delayning the closure of CaV channels. This will cause the elevation of
  as well as the time between [Ca2+] peaks (the period). Overall, the activation of CaKC channels (blue curve), produces a shorter [Ca2+] oscillations due to the faster hyperpolarization, which in turn closes the CaV channels avoiding a big elevation of
  .
.

