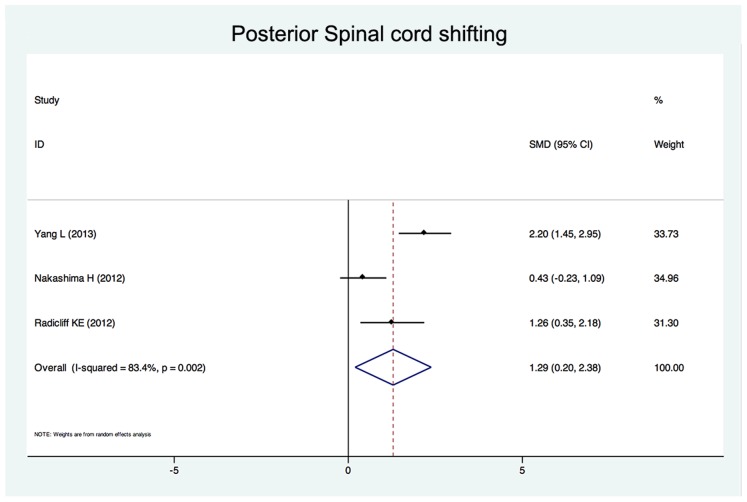
Figure 3. Forest plots for posterior spinal cord shifting.
The width of the horizontal line represents the 95% confidence interval (CI) of the individual studies, and the square proportional represents the weight of each study. The diamond represents the pooled standardized mean difference (SMD) and 95% CI.

