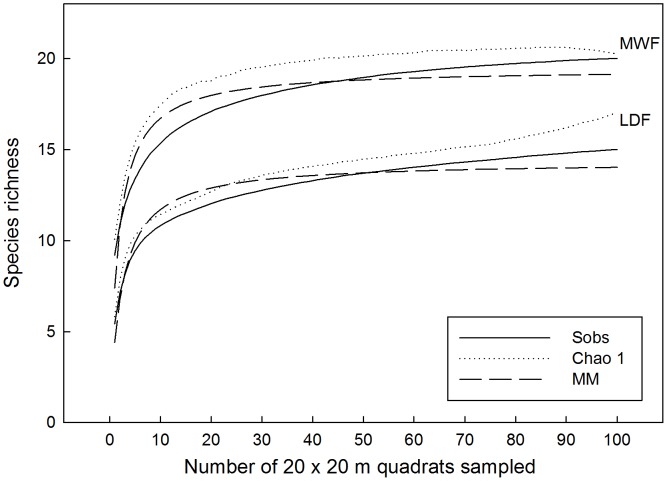
Figure 3. Species accumulation curves.
Species number is shown cumulatively, as additional 20 m×20 m quadrats are sampled, until the entire 4-ha plot is represented (100 quadrats), for Hawaiian montane wet forest (MWF) and lowland dry forest (LDF). Three rarefaction techniques are used: Sobs (observed species number), Chao 1, and MM (Michaelis-Menten).

