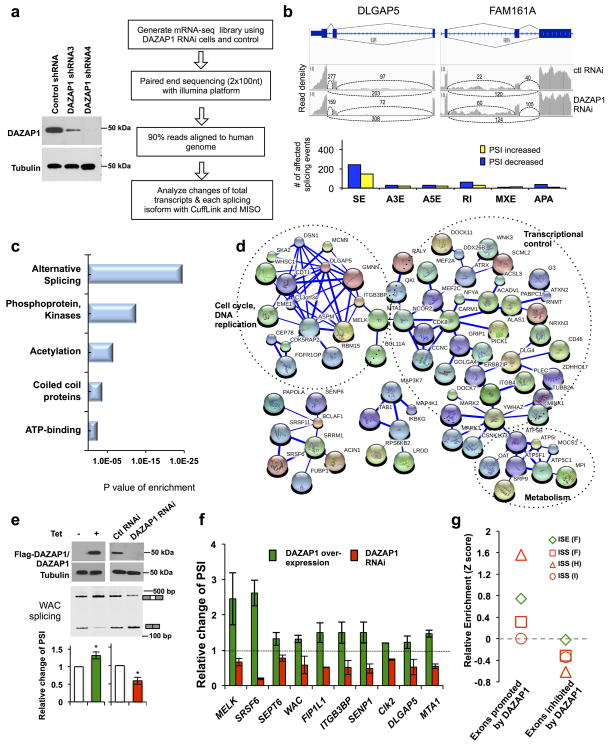
Figure 5. Identification of endogenous alternative splicing events controlled by DAZAP1.
(a) The 293T cells stably transfected with shRNA to knock down DAZAP1 (left panel). The cells were subsequently used for mRNA-seq analyses as shown by schematic diagram in right panel. (b) Upper panel, two examples of alternative exons affected by DAZAP1 knockdown. The genes were chosen to show both the increase and decrease of exon inclusion, and the numbers of exon junction reads were indicated. Lower panel showed the numbers of different splicing events affected by DAZAP1 knockdown. SE, skipped exon; A3E, alternative 3′ splicing site exon; A5E, alternative 5′ splicing site exon; RI, retained intron; MXE, mutually exclusive exon; APA, alternative poly-A sites. (c) The gene ontology analyses of DAZAP1 targets with significant splicing changes after RNAi. The p values were plotted for each enriched functional category. (d) The functional association networks of DAZAP1 targets. Genes in the categories of phosphoproteins and acetylation from panel c were extracted and analyzed with STRING database, and the interaction networks containing more than five nodes were shown. The thickness of line indicates the confidence of interactions. The gene subgroups involved in cell cycle, metabolism and transcriptional control are marked. (e) Confirmation of splicing changes for one of the DAZAP1 targets (WAC) using semi-quantitative RT-PCR in cells with over-expression or RNAi of DAZAP1. The relative changes of PSI compared to controls were calculated, and the mean and s.d. from triplicate experiments were plotted. P values are calculated with t-test. *, p≤0.03. (f) Validation of additional DAZAP1 targets using semi-quantitative RT-PCR in cells with over-expression or RNAi of DAZAP1. The experiments were repeated three times and the relative changes of PSI compared to controls were plotted with s.d. as error bars. For all samples, p ≤0.05 in the paired t-test by comparing PSI value of each gene to that in mock transfected controls (See Supplementary Fig. 6 for detail). (g) Relative enrichment of RNA motifs bound by DAZAP1. Relative enrichment scores were computed for each group in the skipped exons that were positively or negatively regulated by DAZAP1.

