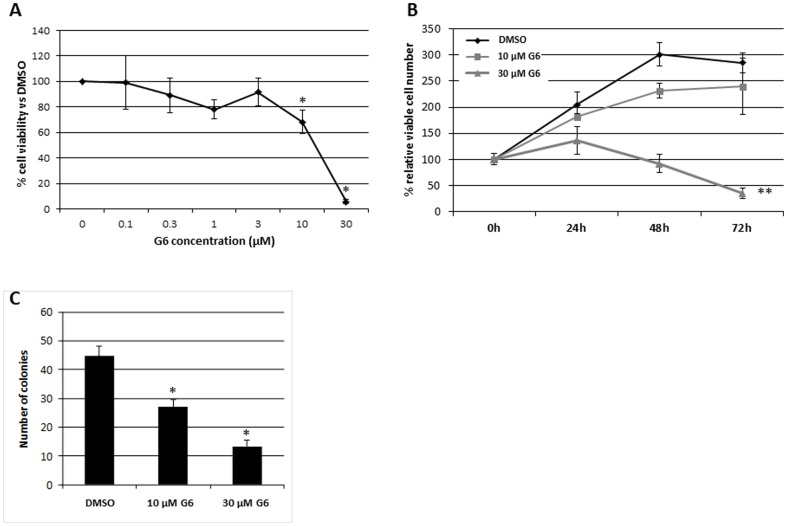
Figure 2. G6 treatment reduces T98G cell viability and clonogenic growth potential.
A) T98G cells were treated with increasing concentrations of G6 for 72 hours and cell viability was measured by MTS assay. Each point was measured in triplicate. Shown is one of three representative results. The 10 µM and 30 µM conditions were significantly lower (p<0.05) when compared to cells treated with DMSO alone as determined by ANOVA. B) T98G cells were treated with G6 for the indicated times and concentrations. Cell viability was then measured via MTS. Each point was measured in triplicate. Shown is one of three representative results. **, p<0.01 relative to DMSO treated cells as determined by ANOVA. C) T98G cells were treated with G6 for 24 hours at the indicated concentrations, washed, and seeded in 100 mm dishes. Cells were grown for nine additional days, stained with crystal violet, and colonies were then counted. Shown is the average of four representative results. *, p<0.05 relative to DMSO treated cells as determined by ANOVA.

