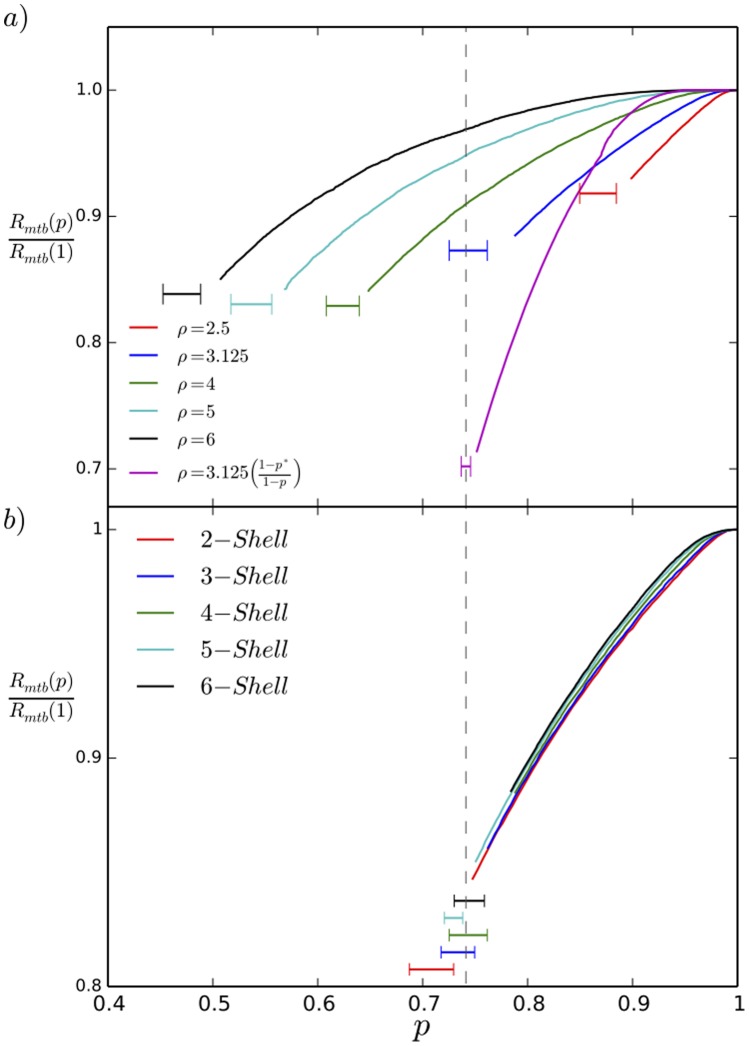
Figure 6. Normalized microtubule bundle radius  vs. tau occupancy
  .
.
In all these curves we show the bundle radius above  with the leftmost end at
  . a) The MTBs undergo a first order collapse with reduced
  , with the collapse onset decreasing with
  for fixed spring constant
  = 0.05 pN/nm. The lavender curve is computed with the same
  value at collapse as the blue curve but for an osmotic pressure proportional to
  . For
. For  (not shown) the radius
  is that of hexagaonally close packed microtubules. b) For varying initial bundle radius, measured by the number of hexagonal shells retained about the central MT, the normalized radius displays the collapse at the same location for a fixed value of
  = 3.125, indicating the collapse is not an artifact of finite size.

