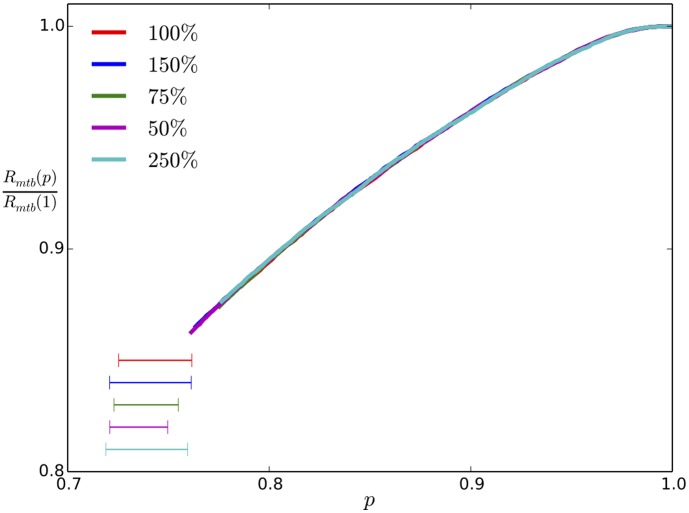
Figure 7. Normalized microtubule bundle radius  vs. tau occupancy for fixed
  .
.
In all these curves we show the bundle radius above  with the leftmost end at
  . Here we carry out the simulations multiplying
  independently by the percentages shown in the legend to achieve the same
  value. Clearly this gives the same
  for collapse onset.

