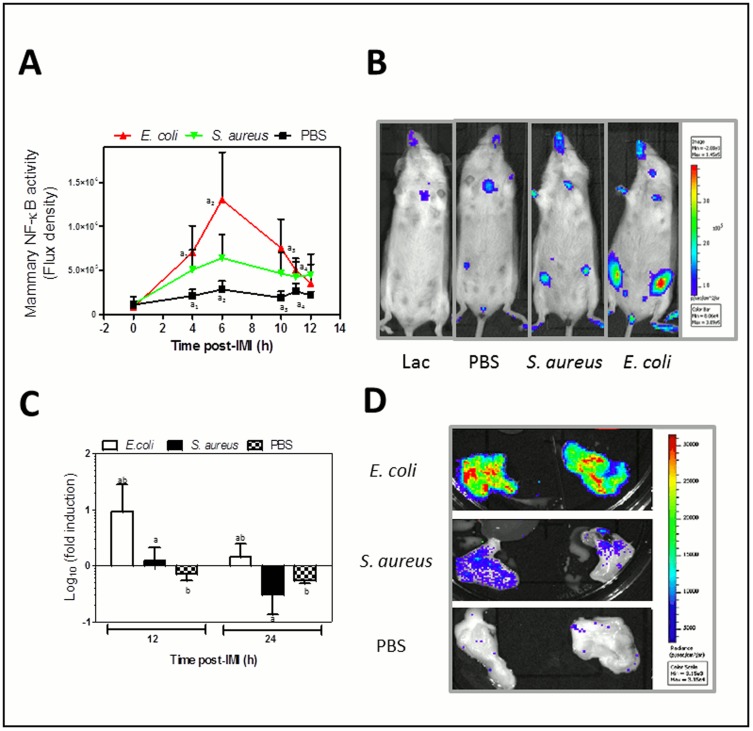
Figure 4. In vivo mammary NF-kappaB activity post-IMI with E. coli compared to S. aureus.
(A) In vivo imaging of local NF-kappaB activity in mammary glands (ventral view) showed a transient and fast activation for both pathogens compared to sham-inoculated (PBS) glands and also about a 3-fold higher activation post-MI with E. coli compared to S. aureus. Data represent the flux density (total flux radiance per selected body area (in p*(s*m2))) as a quantitative measure of the bioluminescent signal correlating with the NF-kappaB activity. (B) A representative photograph of lactating mice (at 0 h, most left) compared to mice at 6 h post-IMI with sham (PBS, 2nd from left), at 6 h post-IMI with S. aureus (3rd from left), or at 6 h post-IMI with E. coli (most right). The intensity of luminescence was scaled based on the radiance (in p*(s*m2)). (C) Mammary glands of NF-kappaB reporter mice were excised at 12 h and 24 h post-IMI and their ex vivo luminescence was measured. The graph represents the ratio between the total flux radiance per area (in p*(s*m2)) at 4 h of the inoculated gland and the value from the non-injected 3th gland in the same mouse. Although the maximal activation occurred earlier, the local NF-kappaB activity was still significantly higher in E. coli compared to S. aureus mammary glands at both these time points of relevance for cytokine transcription. (D) Representative photographical view of excised mammary glands post-IMI with E. coli (top), S. aureus (middle) or after sham-inoculation (PBS, bottom). Letters of homogeneous subsets were marked if the difference between treatments were statistically significant (P<0.05).

