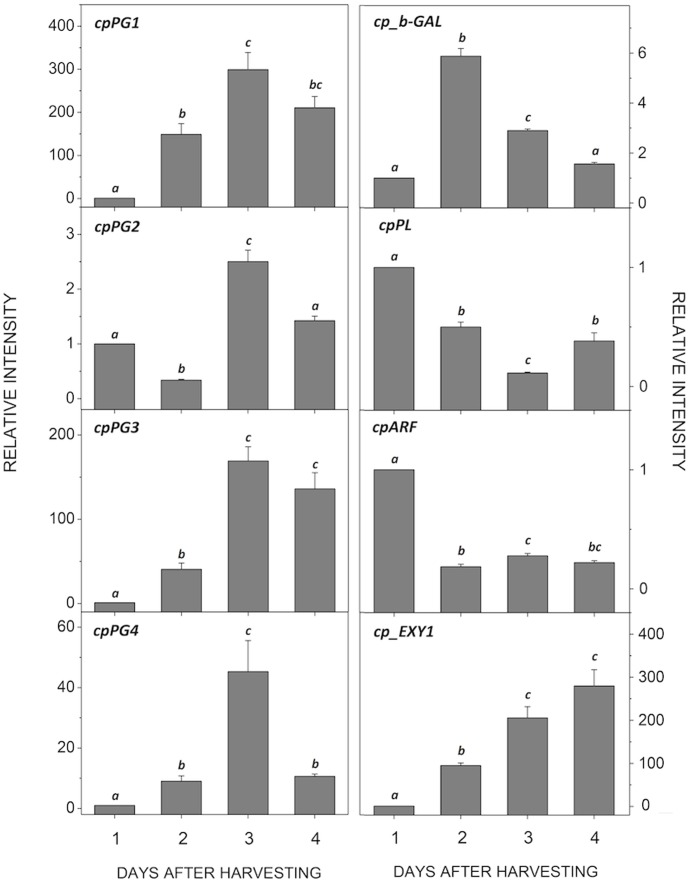
Figure 2. Expression of cell wall-related genes during papaya ripening.
Real-time PCR (qPCR) was used to analyze the mRNA levels of various genes during ripening. The column heights indicate the relative mRNA abundance; the expression values for unripened fruit one day after harvest were set to 1. The error bars on each column indicate the SD of four technical replicates from samplings I and II. The different letters represent samples that were significantly different from those collected on other days post-harvest (within the same gene), as determined by one-way ANOVA and Tukey's test (α<0.05, n = 4).

