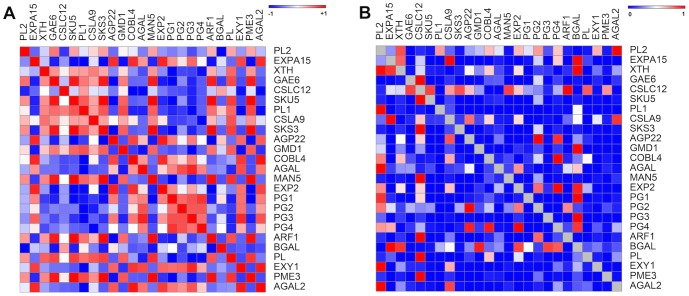
Figure 3. Pearson correlations and associated p-values of papaya cell wall-related genes.
The R package for weighted correlation network analysis (weighted gene co-expression network analysis - WGCNA) was used to calculate the Pearson correlation (Figure A) and the corresponding p-values for the 25 papaya cell wall-related genes that were identified by our group (Figure B). From the 600 possible gene expression correlations, 300 had p-values less than or equal to 0.05 and were further analyzed. Figure 1 A: The heat map is described as positive values set to red color and negative values set to blue color. Figure B: The heat map is described as values near to one set to red color and values near to zero set to blue color. The twenty-five genes are described in Table S1 in File S1.

