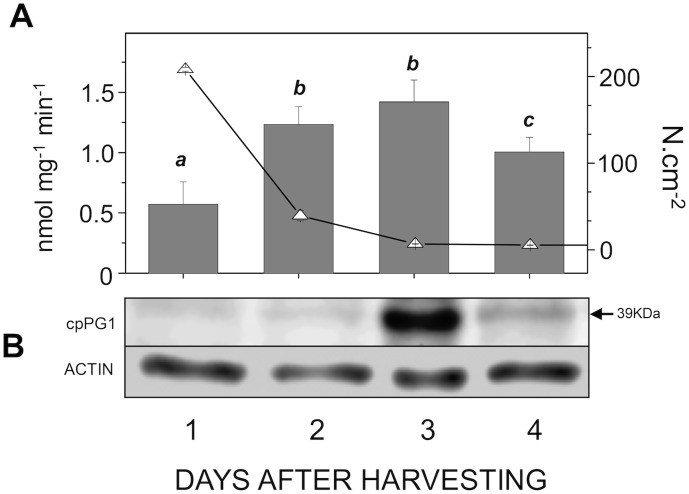
Figure 5. Correlation between pulp softening, enzymatic activity and cpPG1 protein expression during papaya ripening.
A) The pulp firmness (open triangles) was monitored during the ripening process using a texturometer (Fabi et al., 2007), and the measurements are given by N.cm−2. PG enzymatic activities was done according to Fabi et al. (2009). The error bars indicate the SDs of the mean. The different letters represent samples that were significantly different from those collected on other days post-harvest, as determined by one-way ANOVA and Tukey's test (α<0.05, n = 4). B) Western blotting experiment was done using the monoclonal anti-actin for plants as a control experiment (ACTIN), and the images are representative of at least a triplicate experiment. The arrow indicates the molecular weight of the mature protein cpPG1 with the corresponding molecular weight.

