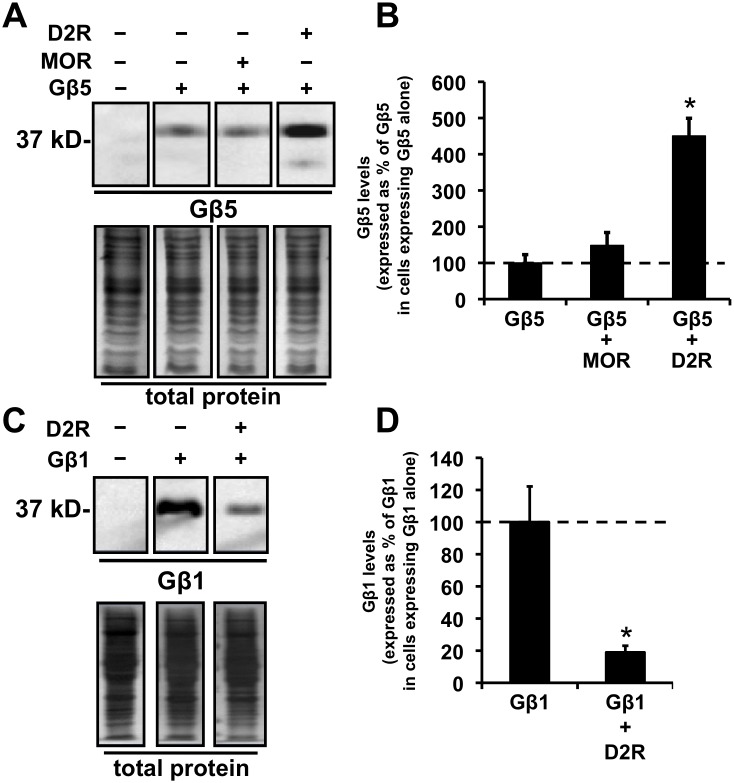
Figure 2. Coexpression of D2R enhances the expression of Gβ5 but not of Gβ1 and coexpression of MOR does not significantly alter expression of Gβ5.
A. Representative images from a Western blot depicting the relative levels of expression of Gβ5 (upper panels) and total cellular protein (lower panels) in HEK293 cells transfected with cDNA for the indicated proteins. B. Quantification of the relative cellular expression levels of Gβ5 after coexpression of MOR or D2R. The Gβ5 protein signal is expressed as a percent of the signal measured in cells expressing Gβ5 alone (mean ± SEM; n = 4, *p<0.05, ANOVA followed by Tukey’s post-hoc test, compared to the levels in cells expressing just Gβ5). C. Representative images from a Western blot depicting the relative levels of expression of Gβ1 (upper panels) or total cellular proteins (lower panels) in HEK293 cells transfected with cDNA for the indicated proteins. D. Quantification of the relative cellular expression levels of Gβ1 after coexpression of D2R. The Gβ1 protein signal is expressed as a percent of the signal measured in cells expressing Gβ1 alone (mean ± SEM; n = 3, *p<0.05, t-test, compared to the levels in cells expressing just Gβ5).

