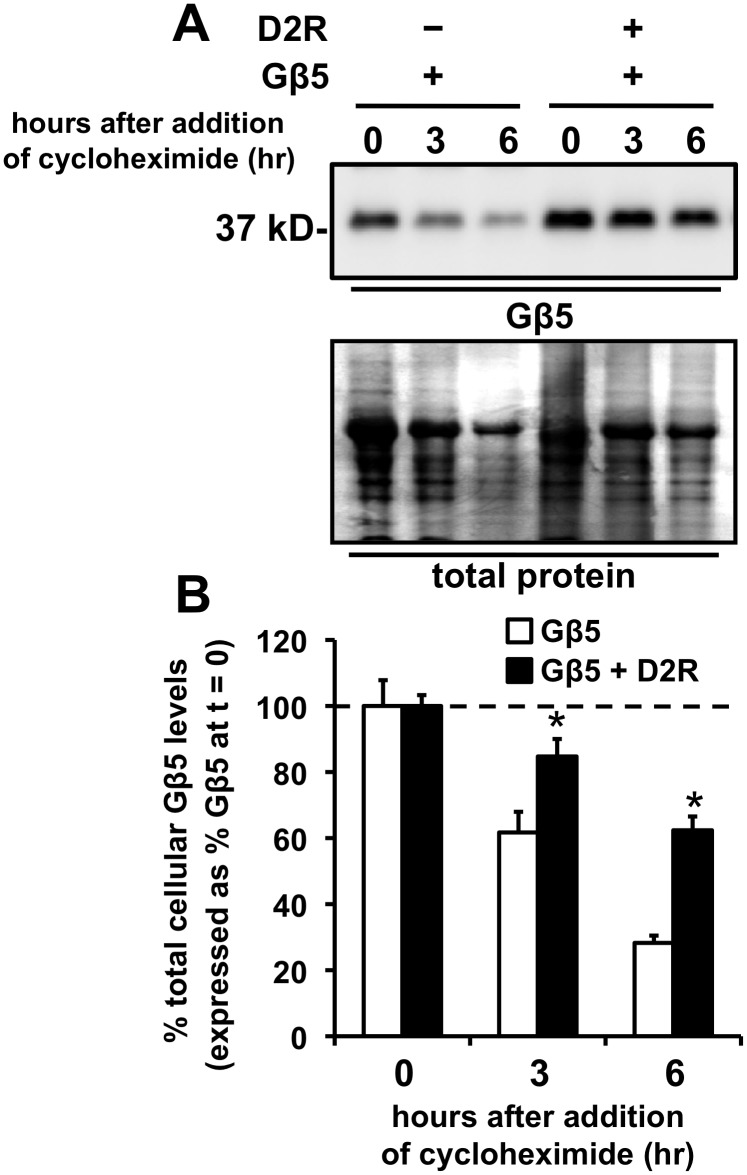
Figure 3. Coexpression of D2R enhances the stability of Gβ5.
A. Representative image of a Western blot which depicts Gβ5 cellular expression levels levels (upper panel) or total cellular protein (lower panel), from HEK293 cells transiently expressing either Gβ5 alone or Gβ5 coexpressed with D2R, at times, t = 0, 3, or 6 hr after treatment with cycloheximide (100 µM). B. Quantification of the reduction in cellular Gβ5 levels after treatment of cells with cycloheximide. The Gβ5 levels at times 3 and 6 hr after cycloheximide treatment are expressed as a percentage of the levels of Gβ5 measured in cells that were not treated with cycloheximide (mean ± SEM; n = 4, *p<0.05, t-test, comparing to the cells that did not coexpress D2R).

