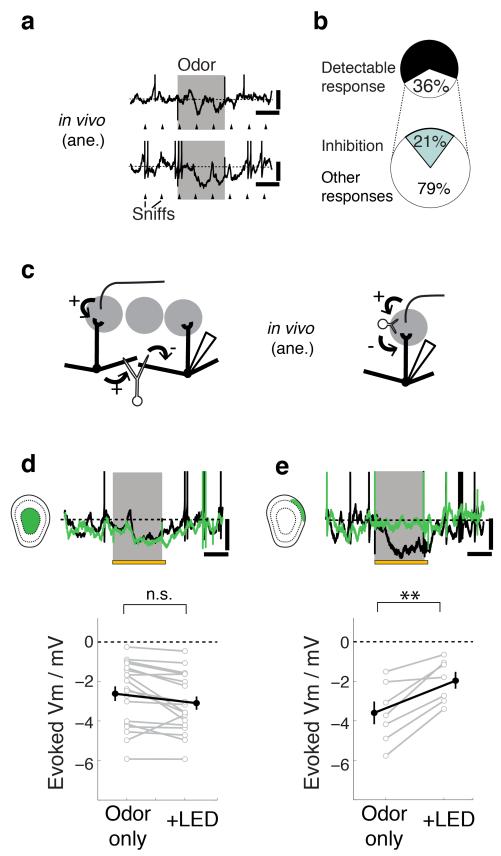
Figure 4. GL inhibition, rather than GC lateral inhibition, underlies slow odor-evoked inhibition.
Odors presented to the animal often evoke sniff-coupled hyperpolarization in M/TCs as shown by two examples (a). Ticks represent the times of expirations peaks. Scale bars = 10 mV, 0.5 s. (b) For all cell-odor pairs (n = 205 pairs, 55 cells), 36% showed detectable responses, of which 21% are purely hyperpolarizing. (c) Two hypotheses for the source of the evoked inhibition: (left) M/TCs that receive excitatory input from neighbouring glomeruli activate GCs, which in turn give lateral inhibition to the recorded cell. (right) Feedforward inhibition within the glomerulus underlies evoked inhibition. (d,e) AAV-FLEX-ArchT was injected into the GCL and glomerular layer of Gad2-Cre or Vgat-Cre animals for layer-selective silencing as in Fig. 3. (d) Effect of GC silencing: Example Vm traces from a M/TC (top) during control (black) and during light presentation (green). Odor presentation (gray) was for 1 s and overlapped with light presentation (yellow) for the LED condition. Scale bars = 10 mV, 0.5 s. (below) Summary of evoked Vm during control (odor only) vs. during GC silencing (+LED). Mean ± s.e.m. shown. n = 19 cells from 13 animals. Odors used = isoamylacetate, methylsalicylate and eugenol at 2-5% saturated vapor. (e) Effect of GL silencing: example traces & summary as in (e). n = 7 cells from 5 animals.

